Just when you thought you knew why the coolest link on the Internet was the Dynochem Mixing Web App, something even cooler has come along, thanks to collaboration between Scale-up Systems and the wider Autochem business unit of Mettler Toledo.
Used correctly, iControl can export an XML file containing the detailed recipe and trends for your experiments in the EasyMax, OptiMax or using RX-10. That means the actual amounts charged and the timing, which may differ from the intended experiments set up in your ELN or elsewhere.
Using iControl 6.2, you can now export that recipe and drag it into the Mixing Web App. The App then reads the entire procedure, breaks out the relevant operations, calculates material properties for each operation using the Scale-up Suite Materials system, reads equipment information from the Scale-up Equipment Data Service and presents the results for Vessels 1 and 2 in the browser.
You can select Vessel 2 from your equipment network and agitation conditions are then automatically scaled at constant power per unit mass. You can adjust fill volumes and recalculate conditions. You can save the results for later re-use, generate a PDF report and share the results with colleagues using the URL for the page.
If your Vessel 2 selection is from the Mettler ecosystem, you can even export the scaled recipe and drag that into iC Data Center using the new integration with Scale-up Suite. Your designed experiment will appear moments later in iControl, ready for execution.
That's scale-up of a complex lab procedure with just a few clicks, saving time and tedium compared to current workflows, now fast and easy enough to de-risk any project.
Take a look at the video here (free Scale-up account required) to see the "S88 XML Recipe Round Trip" in action. To learn more, take the training exercise.
This has a pretty big impact in it's own right. Even better though, it lays a foundation for other round trips and automations, including workflows that include kinetic models and machine learning applications. Watch this space!
Thanks to our web development team, the Dynochem mixing web app continues to deliver new capabilities and the latest enhancements include mixing time, heat transfer and automated scaling calculations based on constant power per unit mass:
Get access and make calculations on your own equipment by signing up here.
This month we delivered our new equipment data service (EDS) capability to more than 150 customer organizations globally. Leading customers adopted the system shortly after release of Scale-up Suite 2 in July 2021; now we are formally going live for everyone.
This SQL database backed approach to managing your equipment data has many advantages compared to the old system of requiring users to find and import our industry-standard Excel-based template, in use since 2011. It is also the only supported way to retrieve your equipment data into the latest version of our mixing and heat transfer toolbox after 30 June 2022.
Features include secure user account based access control, easy access from any device and a change log for traceability.
We have made the administrators of your EDS the same people who are administrators of your Dynochem license. We have sent your admins (custodians of your database) simple instructions to populate the service with your equipment information and make it available to you. For users, as this capability is rolled out, you will start to see the Vessel Update button becoming active in your Dynochem 6 ribbon. Other benefits of adoption include:
Your continued ability to use the latest version of the mixing toolbox with your equipment data after 30 June. The toolbox will no longer have an Excel file Import button, so the only way to include your organization's equipment in the toolbox will be using the EDS (Vessel Update button in the ribbon)
The latest version of the toolbox (30 June) will include a fuller range of Mettler Toledo lab vessels you can easily choose, apply or edit for your applications
Users no longer need to know ‘where the vessel database file is’, to copy and paste it's web address or to browse to locate it on the network
Users can access equipment information in any Excel workbook, using the Catalist and Properties buttons on the DC Excel ribbon
Users on any device can access and view your equipment through a simple web browser interface; they do not need Scale-up Suite installed to do this; they need only to have a scale-up account and be listed on a current valid Dynochem license
The EDS is a foundation for future enhancements that leverage access to equipment data for many other everyday applications
The EDS will support a greater number of database fields, requested by customers to better describe your broad range of equipment types, including biologics set-ups.
Last week, Peter Clark gave a preview of new features coming with Scale-up Suite 2. If you missed the event live, as usual you can catch the recoding in the resources site here.
Peter showed there is something for everyone in the new release. Whatever modality of drug/ active ingredient you develop or make, whether a small or large molecule or somewhere in between, whether made with cell culture or synthetic organic chemistry, your teams and your enterprise can obtain value daily from our tools. That takes us several steps closer to our vision to positively impact development of every potential medicine.
Scale-up Suite 2 includes:
Powerful equipment calculators for scale-up, scale-down and tech transfer, leveraging our industry standard vessel database format
Rigorous material properties calculators for pure components, mixtures and your proprietary molecules
Empirical / machine learning tools, to build and use regression models from your data with just a few clicks; including support for DRSM
Mechanistic modeling of any unit operation, in user-friendly authoring and model development environments
Hybrid modeling, combining the best of both worlds
Interactive data visualization, including parallel coordinates and animated contour plots for multidimensional datasets
New features to make modeling faster, more productive and more enjoyable, incorporating ideas suggested by customers and from our own team
New capabilities for autonomous creation of models, parameter fitting and process optimization 'headless' on the fly, as well as incorporation of real time data and access from any device.
We believe that:
Interdisciplinary collaboration accelerates process development and innovation
Models facilitate collaboration and knowledge exchange
Interactive, real-time simulations save days and weeks of speculation
Models are documents with a lifecycle extending from discovery to patient
Model authoring tools must be convenient and easy to use
Teams needs models that are easily shared
Enterprises need tools that embed a modeling culture and support wide participation.
In other words, modeling should be an option for Everyone. To make that a reality for you, we support our software tools with:
an Online Library, containing hundreds of templates, documentation and self-paced training
Free 1-hour on-line training events monthly
Half-day and full day options for face to face training, available globally
A free certification program to formally recognize your progress and skills
Outstanding user support from PhD qualified experts with experience supporting hundreds of projects like yours
A thriving user community, with round tables and regular customer presentations sharing knowledge and best practices.
We're celebrating 21 years serving the industry this year, supporting more than 20,000 user projects annually, for more than 100 customers all over the world, including 15 of the top 15 pharma companies.
If you're an industry, academic or regulatory practitioner, we invite you to join our user community and start to reap the benefits for your projects.
kLa is an emotive term for many in process development. It evokes a certain mystery for those whose background is not chemical engineering, a 'TLA' they hear over and over again. Obtaining values for this scale-dependent 'mass transfer' parameter can be a significant undertaking, whether by experiments, empirical correlations or even CFD. We provide purpose-designed tools to support fitting kLa to experimental data and for estimation using established correlations. The experimental approach is the subject of this post.
The dominant experimental technique is the dynamic gassing out method, where dissolved gas concentration is followed versus time using a probe in the liquid phase. A shortcut method allows kLa to be backed out from a semi-log plot; an implicit assumption here is that there is an abundance of gas. A more rigorous approach that we advocate fits kLa to a model tracking multi-component mass and composition in both the liquid and gas phases.
The shortcut method contributes to confusion about kLa(O2) versus kLa(CO2), two important gases in cell culture. Dissolved CO2 can be followed using pH probes. Practitioners sometimes report separate values for kLa(O2) and kLa(CO2), with kLa(CO2) typically lower and insensitive to agitation.
CO2 is much more soluble than O2 and the two mass transfers are usually in opposite directions in a bioreactor: O2 from gas to liquid and CO2 from liquid to gas. Incoming air bubbles become saturated with CO2 after a relatively short period of contact, whereas they continue to liberate O2 for most or all of their contact time. That leads to different sensitivities of dissolved O2 and CO2 to agitation and gas flow rate; and therefore different abilities to measure something close to kLa. A very nice study of the gas phase in bioreactors by Christian Sieblist and colleagues from Roche bears out this trend.
Practitioners report that successful bioreactor operation and adequate control over both O2 and CO2 (and hence pH) depends strongly on agitation in the case of O2 and gas flow rate in the case of CO2. In fact, it's a spectrum and kLa and gas flow rate may both be somewhat important for both responses and the particular combination of kLa and gas flow (Qgas) determines the sensitivities for both gases.
We made some response surface plots from a series of gassing out simulations to illustrate. These show the final amount of dissolved gas in solution at the end of each experiment, when kLa and Qgas are varied systematically in a 'virtual DOE'. The initial liquid contained no O2 and some dissolved CO2 that was stripped during the experiment; the gas feed was air, so that dissolved O2 increased during the experiment.
Dissolved O2 at the end of a set of kLa measurement experiments in which kLa and Qgas were varied. The final O2 concentration is always sensitive to kLa and only sensitive to Qgas at very low gas flow rates.
Dissolved CO2 at the end of a set of kLa measurement experiments in which kLa and Qgas were varied. The final CO2 concentration depends only on Qgas at low gas flows; and is sensitive to kLa only at relatively high gas flows.
Transient concentrations of O2 and CO2 at low gas flow respond differently to changes in kLa. In this illustration kLa has been increased between runs from 7 1/hr (dashed line) to 21 1/hr (solid line). The dissolved oxygen profile responds but the CO2 profile remains unchanged (click to enlarge). Clearly, kLa(CO2) cannot be inferred from these data.
Many thanks to customers who engaged with Scale-up Systems as we "built, broke and bettered" our biologics model library in the run-up to release late last year.
More than one hundred biopharmaceutical companies in the Scale-up Suite global user community can now access the tools for immediate use here (https://dcresources.scale-up.com/?q=bio). An overview of the biologics library is available here.
We expect each tool to grow and be refined by the repeated use that is typical of customer activity and we look forward to supporting more users in taking up the tools in their daily work.
Much like the small molecule opportunity, mechanistic modeling has great potential to accelerate the development of large molecules by shortening development time, making best use of experiments and anticipating manufacturing challenges. Ours is the first fit-for-purpose and comprehensive mechanistic model library to be built and released in this space, another first of which we are very proud.
Using the Dynochem biologics library delivers daily benefits in development and scale-up while creating digital twins to support your digitalization strategy
Training opportunities using the new tools will be available at regular intervals this year. Let us know if you'd like a dedicated session for your company or site.
Feel free to share this post with anyone you think may benefit.
The pharma industry practice of 'process fit', which allows the manufacture of most products by re-using existing physical assets, raises the perennial question of whether a given process running well at Lab A or Site B can also be run well at Site C. Anyone who cooks or bakes even occasionally in their own kitchen will know that equipment dimensions and operating conditions affect product quality (and cycle time) and the same is true at manufacturing scale.
This problem used to be handled with a 'boots on the ground' approach, where extensive air travel and time on site allowed detailed oversight, some costly experimentation and tweaks locally before manufacturing. With a large portion of manufacturing now contracted out to CDMOs, tech transfer remains challenging unless you have the right tools.
Working with over 100 companies engaged in the development and manufacture of pharmaceuticals, we get an up-close look at the issues, challenges and opportunities around tech transfer. Probably the single biggest factor that makes our tools indispensable to accelerate this work is the Dynochem Vessel Database.
Users like to achieve 'equivalence' between equipment performance at the transferring and receiving sites. Equivalence may sound simple but the different scaling laws that apply to mixing, heat transfer, solids suspension and mass transfer make this complex; and that's before even considering meso-mixing and micromixing. Apparently inconsequential differences that are easy to miss, such as materials of construction, heat transfer fluids, impeller types, sizes and positions and even feed locations can have a large impact on performance at the receiving site.
The likelihood of Right First Time tech transfer increases dramatically with a sufficiently detailed Vessel Database that accurately stores the configuration of site equipment. Link that with the recipe of the target process, our equipment calculators and peer-reviewed physical properties from our Materials System and you can perform Digital Tech Transfer quickly and accurately without leaving your desk.
If you haven't already created the Vessel Database for your site or wider organization, you can start here from our template. It's an ideal project for a young engineer and once done correctly, saves time for everyone on the team.
Selection of 'impeller' types in the Dynochem Vessel Database; users may also add custom impellers and internals
On a personal level, we shared a lot of laughs and discussions at meetings and conferences of the North American Mixing Forum.
Professionally, Ed was the lead author of the Handbook of Industrial Mixing and before that had an outstanding chemical engineering career with Merck. Ed's observations of mixing effects on homogeneous reactions spawned a whole new field of research and ultimately led to understanding of phenomena such as micromixing and mesomixing.
Ed's 1971 paper following his PhD thesis spawned a whole new field of chemical engineering research
Scale-up Systems was delighted to host Ed in Dublin for a few days in August 2002, when he shared his experiences of Pharmaceutical chemical development and scale-up and delivered extensive notes that we used to strengthen our model library and knowledge base for customers.
Some notes from Ed's consulting visit to Scale-up Systems in Dublin, 2002
If you've been following this series on Industry 4.0, you'll know by now that multiple technologies maturing now or soon are creating significant opportunities for acceleration and transformation in chemical development and manufacturing.
If you already work with our company, you'll have seen the model libraries, software tools, training materials and user support that make everyday applications a reality. If you haven't seen them yet, most likely your company is one of the over 100 with access - contact us if you cannot easily locate your internal champion.
Over 100 companies engaged in the development and commercialization of new medicines rely on our tools at over 400 sites worldwide
We're always listening for feedback and even since this series started have delivered updates in Scale-up Suite to extend support for automation applications, with parallel processing for more tasks and new function calls to return 'data cubes' as arrays in memory from large simulation sets.
We've received excellent feedback from our user base in the fast-growing CMO space, that leveraging our vessel database format for digital tech transfer is helping to reduce costs and failures, increase speed to make room for more customer projects, reduce deviations and modernize the approach to on-boarding new projects.
We hope you've enjoyed this series of six postings. If you want to hear more, join us for our webinar on this topic in early September:
We hope you've been enjoying our free to attend guest webinar program this year as much as we have.
To date in 2018, Syngenta, Johnson Matthey, Nalas, Amgen and Teva have covered topics from one end of a manufacturing stage to the other, addressing synthesis, experimental design, process safety, crystallization and drying.
A reminder that you use your phone to both attend live (Adobe Connect app) and/or enjoy recordings (MP4 format, see iPhone screenshot above). In line with the spirit of GDPR regulations, the identities of our attendees are now anonymized in recordings.
We're impressed by the innovative ways in which users apply our tools and also their openness in discussing process development challenges they face and the solutions they have found. And there's more to come this year, with Sarafinas Process & Mixing Consulting on use of the legendary 'Bourne Reactions', UCD on continuous crystallization, and AstraZeneca on centrifugation, events all in the schedule.
Thanks to Steve Cropper and Peter Clark of our team for continuing to line up a great annual program. 2019 is already looking good, with Flow Chemistry and Drying webinars already planned.
While supporting customers who apply DynoChem for crystallization modeling, we have seen several cases where some of the familiar quantiles of the PSD (D10, D50, D90) reduce with time during at least the initial part of the crystallization process.
On reflection one should not be that surprised: these are statistics rather than the sizes of any individual particles. In fact, all particles may be getting larger but the weighting of the PSD shifts towards smaller sizes (where particles are more numerous, even without nucleation) and in certain cases, this causes D90, D50 and maybe even D10 to reduce during growth.
Last week we had an excellent Guest Webinar from Orel Mizrahi of Teva and Ariel University, who characterized a system with this behaviour, with modeling work summarised in the screenshot below.
D10, D50 and D90 trends in a seeded cooling crystallization: measured data (symbols) and model predictions (curves).
There was a good discussion of these results during Orel's webinar and we decided to make a short animation of a similar system using results from the DynoChem Crystallization Toolbox to help illustrate the effect.
Cumulative
PSD from the DynoChem Crystallization toolbox, showing the evolution of PSD
shape during growth from a wide seed PSD. The movement of quantiles D10,
D50 and D90 is shown in the lines dropped to the size axis of the curve.
In this illustration, the reduction in D50 can be seen briefly and the reduction in D90 continues through most of the process. From the changing shape of the curve, with most of the movement on the left hand side, most of the mass is deposited on the (much more numerous) smaller particles.
We see this trend even in growth-dominated systems, when the seed PSD is wide.
Faced with challenging timelines for crystallization process development, practitioners typically find themselves running a DOE (statistical design of experiments) and measuring end-point results to see what factors most affect the outcome (often PSD, D10, D50, D90, span). Thermodynamic, scale-independent effects (like solubility) may be muddled with scale-dependent kinetic effects (like seed temperature and cooling rate or time) in these studies, making results harder to generalize and scale.
First-principles models of crystallization may never be quantitatively perfect - the phenomena are complex and measurement data are limited - but even a semi-quantitative first-principles kinetic model can inform and guide experimentation in a way that DOE or trial and error experimentation can not, leading to a reduction in overall effort and a gain in process understanding, as long as the model is easy to build.
Scale-up predictions for crystallization are often based on maintaining similar agitation and power per unit mass (or volume) is a typical check, even if the geometry on scale is very different to the lab. A first principles approach considers additional factors such as whether the solids are fully suspended or over-agitated, how well the heat transfer surface can remove heat and the mixing time associated with the incoming antisolvent feed.
The DynoChem crystallization library and the associated online training exercises and utilities show how to integrate all of these factors by designing focused experiments and making quick calculations to obtain separately thermodynamic, kinetic and vessel performance data before integrating these to both optimize and scale process performance.
Users can easily perform an automated in-silico version of the typical lab DOE in minutes, with 'virtual experiments' reflecting performance of the scaled-up process. Even if the results are not fully quantitative, users learn about the sensitivities and robustness of their process as well as its scale-dependence. This heightened awareness alone may be sufficient to resolve problems that arise later in development and scale-up, in a calm and rational manner. Some sample results of a virtual DOE are given below by way of example.
Heat-map of in-silico DOE at plant scale agitation conditions, showing the effects of four typical factors on D50.
The largest D50 is obtained in this case with the highest seeding temperature, lowest seed loading and longest addition (phase 1) time. Cooling time (phase 2) has a weak effect over the range considered.
Later this month we will make our 100th round of updates to tools and content in the DynoChem Resources website, so that these are available immediately to all of our users worldwide. It's appropriate that this 'century' of enhancements is marked by a major release of improved vessel mixing and heat transfer utilities, a cornerstone of scale-up and tech transfer for pharmaceutical companies.
We are grateful to the many users and companies who have contributed requests and ideas for these tools and we have delivered many of these in the 2017 release of the utilities. Ten of the new features are listed below, with a 'shout out' to some customers and great collaborators who led, requested or helped:
Power per unit mass (W/kg) design space for lab reactor;
to produce these results, hundreds of operating conditions are simulated within seconds.
Power per unit mass (W/kg) design space for plant reactor;
to produce these results, hundreds of operating conditions are simulated within seconds.
Design space may be generated with one click on Results tab;
hundreds of operating conditions are simulated within seconds.
A new Design space feature has been included in
several utilities that calculates process results over a user-defined range of
impeller speed and liquid volume. Hundreds of operating conditions are simulated within seconds. When
applied to both Vessel 1 and Vessel 2, this allows identification of a range of
operating conditions in each vessel that lead to similar calculated mixing
parameters.Design space buttons are
available on the Results worksheets and produce tables and response surface plots. [with thanks to Andrew Derrick, Pfizer]
We have enhanced Vessel 1 and Vessel 2 Reports,
including the user’s name, the date and the version number of the utility.Reports now also contain individual impeller
power numbers, UA intercept and UA(v) where applicable. [with thanks to Roel Hoefnagels, J&J]
We have extended our standard list of impellers,
including the two-bladed flat paddle and a marine propeller [with thanks to Ramakanth Chitguppa, Dr Reddys]
Users can now name, include and define multiple
custom/user-defined impellers on the Impeller
properties tab; vessel database custodians can define a custom impeller
list for use across an organization. [with thanks to Ben Cohen and colleagues, BMS]
Users can easily import their organization’s
vessel database (including custom impellers) from a file on the network,
Intranet or web site.This means that
all users can apply the latest utilities from DynoChem Resources and there is
no need for power users / custodians to make separate copies of the utilities
and share them for internal use. [with thanks to Dan Caspi, Abbvie]
One click imports the organization's vessel database and custom impellers
Unbaffled Power number estimates have been
enhanced and made a function of Reynolds number.
We have added calculation of an estimate of the maximum
power per unit mass generated by impellers in a vessel, based on calculations
related to the trailing vortex produced by the blades. [thanks to Ben Cohen, BMS, Andrew Derrick, Pfizer and Richard Grenville, formerly DuPont]
We have added calculation of torque per unit
volume, a parameter sometimes used in systems with higher viscosity and
by agitator vendors.
We have added the Grenville, Mak and Brown (GMB)
correlation as an alternative to Zwietering for solids suspension with axial
and mixed flow impellers [with thanks to Aaron Sarafinas, Dow].
The Grenville Mak and Brown correlation is a new alternative to Zwietering
Some worksheets are partially protected to
prevent unintended edits by users.There
is no password and protection can be removed using Review>Unprotect sheet.
Thanks to all the users who worked with us on crystallization projects, especially during 2015, and received training in 2015 and 2016 on the new cooling and antisolvent crystallization toolbox.
For our part, we've been making some of the requested enhancements and the latest version includes additional options for automatically generating cooling and/or addition rate profiles to reach specific process goals. If you haven't taken a look for a few months, watch this video preview of the quick design sheets and if that whets your appetite, download the toolbox and take the training exercise.
This two-minute video preview shows rapid generation of a solubility curve and quick calculation of potential cooling and/or addition rate profiles and their impact on the rate of crystallization. [Main steps shown with captions - musical accompaniment by Beethoven :)]
We were delighted to release in April our new crystallization process design toolbox, having spent much of 2015 working with customers to better define requirements and piloting the toolbox as it developed in several live sessions.
Inspired by the user interface of our successful solvent swap model, the Main Inputs tab serves as a dashboard for designing and visualizing your crystallization process.
You can get a good intro to the toolbox from the preview webinar we recorded in January 2016. In short, we combined several of our popular crystallization utilities, enhanced them and then automated the building of a crystallization kinetic model in the background. That model is ready to use for parameter fitting and detailed process predictions if you have suitable experimental data.
As you might expect, you can generate a solubility curve within seconds of pasting your data. You can also make quick estimates of operating profiles (cooling and/or addition) for controlled crystallization. And you can estimate the final PSD from the seed PSD and mass. That's all within a few minutes and before using the kinetic model.
The toolbox supports both design of experiments (helping make each lab run more valuable) and design of your crystallization process, especially in relation to scale-up or scale-down. There's a dedicated training exercise that walks you through application to a new project.
We'd be delighted to hear your feedback in due course.
We update our online model library every month and summarize the changes in the WhatsNew document. Each update makes the latest tools and improvements available to all users immediately.
In July, we continued our work to simplify tools and make them easier to apply, focusing on models that work with heat flow (Qr-Qb) data and on crystallization operations. Over the next 6 months, other application areas will receive the same review and enhancement.
We are fortunate to have Dr Wilfried Hoffmann in our team, who after nearly 29 years at Pfizer, with responsibilities and expertise ranging from thermochemistry to PAT and modeling, joined our team in 2012. Wilfried led the review of the heat flow models and the changes reflect his experience and expertise. Simple models allow rapid estimation of kinetics with very little input data and separate models translate the chemistry (by copy and paste) to larger scale conditions. Search for 'Qr' and 'exotherm' in the DCR search box to find these tools.
Decomposition reactions can be included easily alongside the synthetic chemistry reactions and safety scenarios can be explored to minimise 'accumulation' or maximize the time to maximum rate (TMR) after a cooling failure. Many of you will have seen the 2013 webinar by Bernhard Berger of Siegfried in this application area; if not, it is well worth your time to review.
The crystallization library was also enhanced with a clearer workflow among the various tools involved and consistent, rigorous kinetics applied across all models. The previous blog post highlighted some excellent results achieved using these models, using Lasentec (CLD) data to obtain the kinetics of the true crystal size distribution (CSD), taking account of particle shape.
There will be webinars in both application areas later this year to review the improvements. See the list of current events anytime by visiting here.
Careful measurements of fed batch process dynamics in antisolvent crystallization systems are quite few and far between. A useful paper by the UCD Crystallization group from 2007 showed effects of agitator speed and antisolvent addition rate on the observed metastable zone width (MSZW) of benzoic acid crystallizing in ethanol/water. An FBRM probe was used to detect the onset of nucleation and MSZW was generally wider at higher addition rates. MSZW was also a little wider at higher agitation speed when the feed point was not well located (above surface near the wall of the vessel). It became narrower with higher agitation speed when the feed was more directly into the impeller suction, an effect that can be explained by the dependence of nucleation rate on agitator speed.
Higher than average supersaturation exists near the feed point and this can lead to premature nucleation, or a negative MSZW; this was observed in the UCD study at the less effective feed position. CFD calculations of the flow patterns in the lab vessel were used to explain some of the mixing effects. A paper from the UCD group in 2011, based on research in the SSPC consortium, included analysis of relevant turbulent mixing time constants estimated from CFD calculations. Other nice work in this field includes the PhD of Christian Lindenberg of ETH Zurich, the institution where Professor John Bourne completed much of his work on micromixing.
Integrated, predictive models for a system like this are useful to help practitioners to find conditions producing the right crystal number (and size) in this commonly used configuration, whether seeded or not. The scale-dependent equipment characteristics are one part and we can leverage insights from the micromixing and mesomixing research community; the DynoChem library contains tools to quantify and apply these time constants, as described in a previous post. The system-specific crystal nucleation and growth kinetics are another part and these may be fitted to solute concentration and particle number data collected during lab experimentation. Users may select from a range of rate expressions that may or may not include MSZW as a parameter; this carries some disadvantages in predictive mode as it is somewhat dependent on the conditions under which it was measured.
We have integrated these elements into detailed and fast-running models when supporting customers on projects in this area. We typically use a feed-zone model, in which the zone size depends on the quality of mixing and its composition lies between that of the feed material (often pure antisolvent) and the bulk. In this zone, if nucleation kinetics are rapid, significant nucleation can occur due to high local supersaturation. Those nuclei appear before the system as a whole is supersaturated (negative MSZW) and will mostly redissolve in the bulk if the system is not yet supersaturated as a whole. They continue to be produced throughout the feed addition process, for as long as a (local) superaturation driving force exists.
DynoChem simulation results using this integrated model for a system like the benzoic acid/ ethanol/ water system are shown below, using typical values for crystallization kinetics and driving forces based on supersaturation (not MSZW).
Figure 1:The model produces typical supersaturation curves for an unseeded system, with rising supersaturation reaching a peak that occurs at higher wt% antisolvent when the addition rate is higher. (Note that with the kinetic parameters used, the peak occurs slightly sooner at higher agitator speed.)
Figure 2: The number of particles formed in the system is higher when the addition rate is faster; this tallies with the higher level of supersaturation reached, with a greater driving force for nucleation. The simulation includes a direct effect of impeller speed on nucleation, leading to more particles at higher agitation speed (and fast addition).
Figure 3: In this model, the number of particles in the feed zone is tracked separately from those in the bulk; this number depends primarily on the quality of meso- and micromixing and there are more particles formed in the feed zone at lower agitator speeds. The number of particles in the feed zone is significantly higher with fast feeding. Note that particles are formed from the start of the addition but many of the 'oldest' dissolve in the bulk while those formed later have a better chance of remaining out of solution.
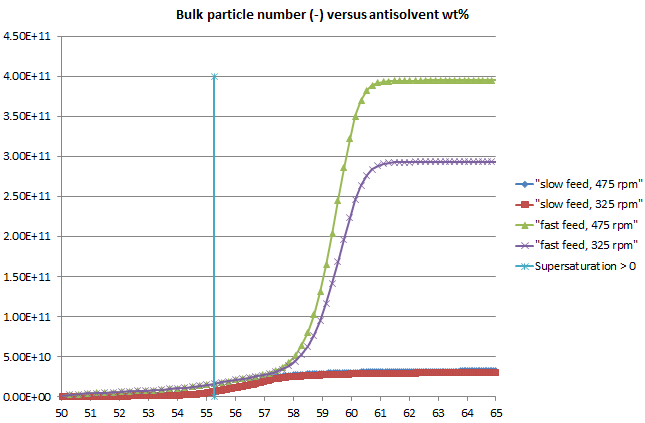
Figure 4: A plot of bulk particle number versus wt% antisolvent, with the scale reduced to highlight the first signs of particles in the bulk, indicates that a large number of particles may exist even when the system is undersaturated and the number of particles can be several times higher with fast feeding than with slow.
Such a particle number profile would make it more likely that a negative MSZW would be observed at higher addition rates when the FBRM (or other particle monitoring) probe may detect the larger particle number.
A potentially interesting parameter to complement MSZW is the observed induction time, which in the case of the present system reduces at higher addition rates and is often well under 1 second. This underlines the importance of rapid local mixing of the feed and induction time could be used to calculate a Damkoehler type number for the system.
The stochastic nature of both MSZW and induction time is well recognized and addressed again in a recent paper.
From a practical point of view, all of this makes it even clearer that relying on uncontrolled primary nucleation as a means to obtain a desired crystal size (or number) can be a risky approach. The same models shown here can be used to investigate the impact of seeding and to find more robust, growth-dominated conditions in a specific system.
Whatever about the quantitative and specific interpretation of the simulation results shown, the power to quickly visualize these potential impacts before experiencing them in practise is of great educational value and assists with experimental design and planning. Which reminds me of the poster I saw on the wall at a large chemical company several years ago, which read: "Don't speculate, Simulate!".
By means of an exothermal oxidation it is shown how with a few experiments a DynoChem model for heat generation can be generated. (Anwendungen von DynoChem in der Prozess-Sicherheit - Optimierung von Akkumulation und TMR. Am Beispiel einer exothermen Oxidationsreaktion wird gezeigt, wie mit wenigen Experimenten ein DynoChem Modell der Wärmeerzeugung dieser Reaktion bestimmt werden kann).
The above links to an extract from the DynoChem guest webinar last week by Dr Franjo Jovic of Pliva (part of Teva group). Franjo talked about how the design space for an API hydrogenation reaction step was defined using DynoChem and model predictions verified with experimental results. The full version of the webinar is available here.
Many are familiar with the term 'solvent test' as a means of characterizing vessel heat transfer and sometimes also gas-liquid mass transfer. Another type of characterization test addresses the turbulent energy distribution in a vessel and uses experiments with Bourne reactions (mixing-sensitive) together with a mathematical model.
These techniques enable a quantitative estimate of the local power per unit mass (or volume) at a specific feed location. That is useful when scaling processes that are mixing-sensitive, such as some fast / dosing-controlled reactions and some antisolvent crystallizations.
XQ (or XS) from the Bourne chemistry depends on the mixing rate near the feedpoint. When the experiments are micromixing-controlled, XQ is independent of feed time; this occurs at longer feed times. In those circumstances, the local epsilon (W/kg) may be estimated directly from the Engulfment frequency that corresponds with the measured XQ:
(Equation 1)
An example model-generated curve relating XQ and epsilon is shown in Figure 1 below: given a measured XQ under micromixing-controlled conditions, epsilon can be read from the x-axis:
Figure 1: Example plot of XQ versus epsilon (W/kg) under micromixing-controlled conditions.
The value of experiments to measure XQ depends on running the chemistry under mixing-sensitive conditions. If you are planning experiments like these, you should first use a model with estimated epsilon to identify both chemical (concentrations) and mixing conditions (e.g. rpm) that will lead to sensitivity in your case. Our utilities provide good estimates of the parameters you need. Then when you have your measured XQ results, you can back-calculate epsilon.
DynoChem is the only software that contains these readymade tools for characterizing your equipment and handling micromixing and mesomixing limited systems during process development and scale-up. Sign up to find out more.