We were delighted to release in April our new crystallization process design toolbox, having spent much of 2015 working with customers to better define requirements and piloting the toolbox as it developed in several live sessions.
Inspired by the user interface of our successful solvent swap model, the Main Inputs tab serves as a dashboard for designing and visualizing your crystallization process.
You can get a good intro to the toolbox from the preview webinar we recorded in January 2016. In short, we combined several of our popular crystallization utilities, enhanced them and then automated the building of a crystallization kinetic model in the background. That model is ready to use for parameter fitting and detailed process predictions if you have suitable experimental data.
As you might expect, you can generate a solubility curve within seconds of pasting your data. You can also make quick estimates of operating profiles (cooling and/or addition) for controlled crystallization. And you can estimate the final PSD from the seed PSD and mass. That's all within a few minutes and before using the kinetic model.
The toolbox supports both design of experiments (helping make each lab run more valuable) and design of your crystallization process, especially in relation to scale-up or scale-down. There's a dedicated training exercise that walks you through application to a new project.
We'd be delighted to hear your feedback in due course.
There are lots of tools for modeling in various forms and it is sometimes hard for practitioners to see the best way to proceed. It would be interesting to measure the percentage of scientist and engineer time spent staring at Microsoft Excel spreadsheets, writing formulas, plotting data and hoping for inspiration. Or at the other end of the spectrum, writing low level computer code to implement mathematical analysis, repeating the same bugs and logic errors as everyone else who has tried. In our busy industry, it is a mistake to think that this activity adds maximum value. The effort required just to make such a model understandable to others is more than you can afford and many projects produce dead branch tools, perpetuating the problem.
Into this space, we project DynoChem, the industry standard tool for fast modeling of equipment (mixing, heat transfer), properties (especially common solvents and proprietary compounds), reactions, crystallization, distillation and downstream operations. The speed of model creation from existing libraries is impressive and models can vary from the very simple to extremely complex. Teams with industrial experience and PhD qualifications help to develop the tools, support customers and train users globally. New user communities grow within industry, tackling downstream operations, product stability and product performance at the point of use.
In spite of being the market leader, we are only beginning. There is much more impact to come, as users turn away from general purpose calculators towards tools that are fit for purpose. Helping make that transition, we continue to make our tools simpler and at the same time more powerful, the latter being the main subject of today's post.
Among the toughest simulation problems is predicting the shape of a crystal size distribution (CSD). Fortunately, many problems with CSD can be solved without predicting CSD shape; in fact the mainstream way to solve these problems remains trial and error, mixed with sometimes endless experimentation. For nearly 15 years, we have helped crystallization users to be more rational and scientific about solving CSD problems by taking a systematic approach and substituting thinking for some of the experimentation. Advances in computing technology have brought CSD prediction within the realm of the standard PC, as long as users do a few appropriate experiments to fit model parameters. We added prediction of CSD shape to our online model library in 2012 and recently completed a further iteration to make this capability more powerful and easier to apply.
We are delighted that DynoChem has the most accurate tools for prediction of CSD shape in the industry, with models using both finite volume (fixed size classes) and the method of characteristics (moving size classes). The latter method is extremely attractive as it contains no 'numerical diffusion', a problem that afflicts any PDE solver using the finite volume method. No other process simulation software offers this method, as far as we are aware. We also have the best solubility prediction tool and the fastest solubility regression (takes < 1 minute from data input to model completion, compared to other tools that require hours and specialized expertise).
For CSD shape prediction, we concentrate on nucleation and growth models. Our workflow involves several tools in which each performs a single task, including conversion of apparent CSD (for example Lasentec data) to moments, fitting a solubility curve, fitting nucleation and growth kinetics, predicting true CSD shape, comparing true CSD and apparent CSD using particle shape information, refitting the kinetics if necessary and making definitive predictions of true CSD.
Some example results for CSD are shown below. Each graph was produced using our moving size classes model, which captures the distribution accurately with no numerical diffusion. Contact our support and training team if you'd like to discuss this application with us.
Figure 1: Our workflow produces excellent agreement between predicted and measured number distributions for CLD in this example; navy points are the predicted CSD from the population balance model; green points are the measured CLD; the green curve (hardly visible under the green points) is the predicted CLD when the CSD is converted using our virtual CLD probe, knowing the crystal shape.
Figure 2: Crystal number density distribution, n(L), plotted versus size for the same example. When particle shape (aspect ratio) is taken into account, our virtual CLD probe indicates the conversion factor between CLD and CSD, which allows the true CSD in the L dimension (navy points) to be fitted to CLD data (green points) sampling all dimensions. The fit may then be checked using the virtual CLD probe (producing the green curve from the predicted CSD).
Figure 3: When measured CLD and true CSD are assumed to be equivalent (no correction for particle shape), the cumulative number distribution for CSD predicts a CLD that is too large in this case compared with the measured CLD.
Figure 4: The impact of treating CLD as CSD is shown more clearly from the number density distribution, n(L) plot. When predicted CSD is converted to a CLD by the virtual CLD probe, predicted and measured CLD (green curve and points) do not agree. In this example, the predicted CSD assuming this 1:1 equivalence and without accounting for particle shape contains a slightly bimodal distribution, due to differences in timing between peaks in primary and secondary nucleation. This feature disappears (see Figure 2 above) when the correct CLD-CSD relationship is included in the model.
Careful measurements of fed batch process dynamics in antisolvent crystallization systems are quite few and far between. A useful paper by the UCD Crystallization group from 2007 showed effects of agitator speed and antisolvent addition rate on the observed metastable zone width (MSZW) of benzoic acid crystallizing in ethanol/water. An FBRM probe was used to detect the onset of nucleation and MSZW was generally wider at higher addition rates. MSZW was also a little wider at higher agitation speed when the feed point was not well located (above surface near the wall of the vessel). It became narrower with higher agitation speed when the feed was more directly into the impeller suction, an effect that can be explained by the dependence of nucleation rate on agitator speed.
Higher than average supersaturation exists near the feed point and this can lead to premature nucleation, or a negative MSZW; this was observed in the UCD study at the less effective feed position. CFD calculations of the flow patterns in the lab vessel were used to explain some of the mixing effects. A paper from the UCD group in 2011, based on research in the SSPC consortium, included analysis of relevant turbulent mixing time constants estimated from CFD calculations. Other nice work in this field includes the PhD of Christian Lindenberg of ETH Zurich, the institution where Professor John Bourne completed much of his work on micromixing.
Integrated, predictive models for a system like this are useful to help practitioners to find conditions producing the right crystal number (and size) in this commonly used configuration, whether seeded or not. The scale-dependent equipment characteristics are one part and we can leverage insights from the micromixing and mesomixing research community; the DynoChem library contains tools to quantify and apply these time constants, as described in a previous post. The system-specific crystal nucleation and growth kinetics are another part and these may be fitted to solute concentration and particle number data collected during lab experimentation. Users may select from a range of rate expressions that may or may not include MSZW as a parameter; this carries some disadvantages in predictive mode as it is somewhat dependent on the conditions under which it was measured.
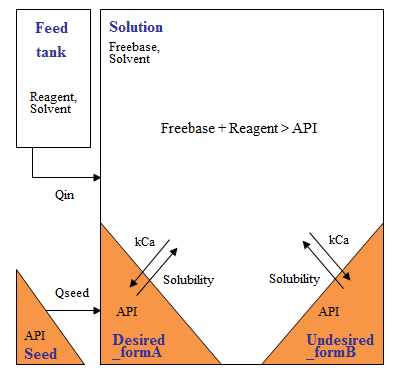
We have integrated these elements into detailed and fast-running models when supporting customers on projects in this area. We typically use a feed-zone model, in which the zone size depends on the quality of mixing and its composition lies between that of the feed material (often pure antisolvent) and the bulk. In this zone, if nucleation kinetics are rapid, significant nucleation can occur due to high local supersaturation. Those nuclei appear before the system as a whole is supersaturated (negative MSZW) and will mostly redissolve in the bulk if the system is not yet supersaturated as a whole. They continue to be produced throughout the feed addition process, for as long as a (local) superaturation driving force exists.
DynoChem simulation results using this integrated model for a system like the benzoic acid/ ethanol/ water system are shown below, using typical values for crystallization kinetics and driving forces based on supersaturation (not MSZW).
Figure 1:The model produces typical supersaturation curves for an unseeded system, with rising supersaturation reaching a peak that occurs at higher wt% antisolvent when the addition rate is higher. (Note that with the kinetic parameters used, the peak occurs slightly sooner at higher agitator speed.)
Figure 2: The number of particles formed in the system is higher when the addition rate is faster; this tallies with the higher level of supersaturation reached, with a greater driving force for nucleation. The simulation includes a direct effect of impeller speed on nucleation, leading to more particles at higher agitation speed (and fast addition).
Figure 3: In this model, the number of particles in the feed zone is tracked separately from those in the bulk; this number depends primarily on the quality of meso- and micromixing and there are more particles formed in the feed zone at lower agitator speeds. The number of particles in the feed zone is significantly higher with fast feeding. Note that particles are formed from the start of the addition but many of the 'oldest' dissolve in the bulk while those formed later have a better chance of remaining out of solution.
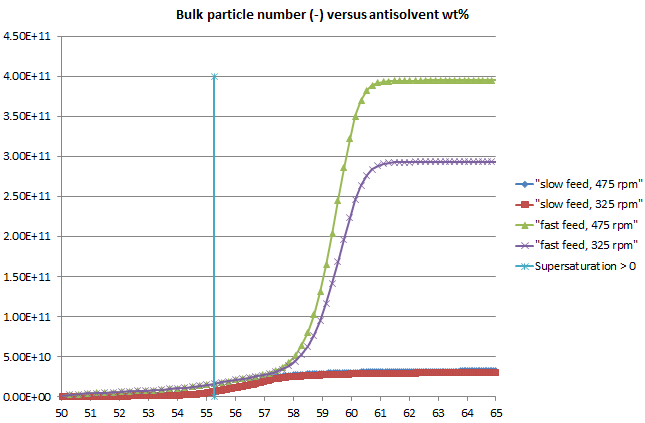
Figure 4: A plot of bulk particle number versus wt% antisolvent, with the scale reduced to highlight the first signs of particles in the bulk, indicates that a large number of particles may exist even when the system is undersaturated and the number of particles can be several times higher with fast feeding than with slow.
Such a particle number profile would make it more likely that a negative MSZW would be observed at higher addition rates when the FBRM (or other particle monitoring) probe may detect the larger particle number.
A potentially interesting parameter to complement MSZW is the observed induction time, which in the case of the present system reduces at higher addition rates and is often well under 1 second. This underlines the importance of rapid local mixing of the feed and induction time could be used to calculate a Damkoehler type number for the system.
The stochastic nature of both MSZW and induction time is well recognized and addressed again in a recent paper.
From a practical point of view, all of this makes it even clearer that relying on uncontrolled primary nucleation as a means to obtain a desired crystal size (or number) can be a risky approach. The same models shown here can be used to investigate the impact of seeding and to find more robust, growth-dominated conditions in a specific system.
Whatever about the quantitative and specific interpretation of the simulation results shown, the power to quickly visualize these potential impacts before experiencing them in practise is of great educational value and assists with experimental design and planning. Which reminds me of the poster I saw on the wall at a large chemical company several years ago, which read: "Don't speculate, Simulate!".
Modeling form conversion has been an option in DynoChem for more than a decade. In fact in our experience it is sometimes a model that first flags up the form change, as the measured composition data will not fit any other explanation. You can find a demo model and starting example for solution mediated form conversion in your system and a strategy for avoidance here.
Salt disproportionation is another major concern in this field and there is a DynoChem template for that as well. Jeremy Merritt and colleagues from Lilly showed how this phenomenon was predictable with DynoChem based on known properties of your salt and excipients, with the software tracking multiple solid phases and the detailed chemical equilibria that arise. You can find the disproportionation starting tool here.
When completing the publication of our latest monthly update to the DynoChem online library of tools, we revised our CSD (crystal size distribution) to CLD (chord length distribution) conversion utility and the latest file is here.
We think this tool has educational as well as practical value, with plots of size distribution statistics and indications of how true CSD relates to what we can measure using on-line laser backscattering (an apparent CLD) or off-line laser diffraction (an apparent spherical equivalent diameter distribution).
Like all of our tools, we are keen to receive feedback by email to our support team and to make further enhancements in due course. If you like it, or think it can be improved, let us know.
Believe it or not, it is possible to find humour even in such technical material and we present below our latest CSD joke, this time from the Doctor, Doctor genre. It goes:
Patient: 'Doctor, Doctor, I don't understand the statistics of my size distribution.'
Doctor: 'Please weight a moment.'
If you like the joke, or can improve it, write a comment.
Templates that use nucleation and growth kinetics in population balance models have been available in the DynoChem online library for some time. These are a great alternative to writing all of your own code for this problem in MatLab or Excel, or investing in complex software that is in permanent beta-test mode and 'one up from Fortran'. On the other hand, our templates give you total control over the form of the rate equations, so they are ideal for research purposes. And you benefit from the features that power users love, like variable time steps, stiff solvers, flexible data handling in Excel format and so on.
DynoChem provides a general-purpose platform for operation modeling and the same environment can be used for anything from early phase reaction kinetics by process chemists through to late phase solvent swap, filtration and drying by process engineers and beyond that into drug product, dissolution and stability applications. In the pharmaceutical industry, makers of API find countless opportunities to apply these tools over and over again.
Our population balance models come in various shapes and sizes, depending on what you need to accomplish. The most rigorous of these divide the distribution into size 'classes', with linear or log-spaced intervals, and calculate the number of crystals in each class during nucleation and growth. Another variant does the reverse, with breakage and dissolution as API crystals dissolve from a tablet in the USP apparatus (or the stomach).
Knowledge of solubility and measurement of some crystallization profiles (notably solute concentration during crystallization) allow the kinetic parameters to be estimated, using the classical approaches described in Mullin's book and many other places. Armed with reasonable estimates for these parameters, valuable insights into the CSD may be obtained.
During antisolvent crystallization, composition gradients may exist near the feed point and even this can be predicted efficiently using meso- and micromixing models implemented by our team of fluid mixing experts. In general, equipment characterization completes the picture, with the ability to calculate heat transfer, solids suspension and power per unit volume using simple 'utilities'.
Here we show the beneficial impact of seed addition during a cooling crystallization: more seed (up to maximum 3.2% in this case) suppresses nucleation, eliminates a bimodal size distribution (and filtration problems plus product variability concerns) and leads to smaller sizes and a tight distribution.
The particle engineering community will soon have a new DynoChem template to work with. Probably available in the April DCR update (number 61), we have implemented the Vogel & Peukert model and users can now simulate either wet or dry milling as a means of adjusting and controlling crystal size.
The process scheme for the wet milling template looks like this:
You can fit material characteristics to data from lab trials and then simulate scale-up and changes in operating conditions:
And you can link the milling model to a crystallization model to crystallize while milling.
Well, that's what you get when you work with a modeling platform that is fit for purpose for today's pharma industry. Watch out for more new tools like this in our monthly updates.


.png)
.png)
.png)

