Showing posts with label Mass Transfer. Show all posts

Tuesday, June 21, 2022

New: Dynochem Equipment Data Service (EDS) puts equipment data at your fingertips

This month we delivered our new equipment data service (EDS) capability to more than 150 customer organizations globally.  Leading customers adopted the system shortly after release of Scale-up Suite 2 in July 2021; now we are formally going live for everyone.

This SQL database backed approach to managing your equipment data has many advantages compared to the old system of requiring users to find and import our industry-standard Excel-based template, in use since 2011.  It is also the only supported way to retrieve your equipment data into the latest version of our mixing and heat transfer toolbox after 30 June 2022.  

Features include secure user account based access control, easy access from any device and a change log for traceability.

We have made the administrators of your EDS the same people who are administrators of your Dynochem license.  We have sent your admins (custodians of your database) simple instructions to populate the service with your equipment information and make it available to you.  For users, as this capability is rolled out, you will start to see the Vessel Update button becoming active in your Dynochem 6 ribbon.  Other benefits of adoption include:

  • Your continued ability to use the latest version of the mixing toolbox with your equipment data after 30 June.  The toolbox will no longer have an Excel file Import button, so the only way to include your organization's equipment in the toolbox will be using the EDS (Vessel Update button in the ribbon)
  • The latest version of the toolbox (30 June) will include a fuller range of Mettler Toledo lab  vessels you can easily choose, apply or edit for your applications
  • Users no longer need to know ‘where the vessel database file is’, to copy and paste it's web address or to browse to locate it on the network
  • Users can access equipment information in any Excel workbook, using the Catalist and Properties buttons on the DC Excel ribbon
  • Users on any device can access and view your equipment through a simple web browser interface; they do not need Scale-up Suite installed to do this; they need only to have a scale-up account and be listed on a current valid Dynochem license
  • The EDS is a foundation for future enhancements that leverage access to equipment data for many other everyday applications
  • The EDS will support a greater number of database fields, requested by customers to better describe your broad range of equipment types, including biologics set-ups.

Otherwise, contact support@scale-up.com to find out who your admin is and here's a 1-minute (silent) YouTube video showing the EDS in action:

Dynochem: Secure access to equipment info, for users of your Equipment Data Service
Additional useful resources include:

Tuesday, March 23, 2021

Bioreactor mass transfer: kLa (O2) versus kLa (CO2)

kLa is an emotive term for many in process development.  It evokes a certain mystery for those whose background is not chemical engineering, a 'TLA' they hear over and over again.  Obtaining values for this scale-dependent 'mass transfer' parameter can be a significant undertaking, whether by experiments, empirical correlations or even CFD.  We provide purpose-designed tools to support fitting kLa to experimental data and for estimation using established correlations.  The experimental approach is the subject of this post.

The dominant experimental technique is the dynamic gassing out method, where dissolved gas concentration is followed versus time using a probe in the liquid phase.  A shortcut method allows kLa to be backed out from a semi-log plot; an implicit assumption here is that there is an abundance of gas.  A more rigorous approach that we advocate fits kLa to a model tracking multi-component mass and composition in both the liquid and gas phases.

The shortcut method contributes to confusion about kLa(O2) versus kLa(CO2), two important gases in cell culture.  Dissolved CO2 can be followed using pH probes.  Practitioners sometimes report separate values for kLa(O2) and kLa(CO2), with kLa(CO2) typically lower and insensitive to agitation.

CO2 is much more soluble than O2 and the two mass transfers are usually in opposite directions in a bioreactor: O2 from gas to liquid and CO2 from liquid to gas.  Incoming air bubbles become saturated with CO2 after a relatively short period of contact, whereas they continue to liberate O2 for most or all of their contact time.  That leads to different sensitivities of dissolved O2 and CO2 to agitation and gas flow rate; and therefore different abilities to measure something close to kLa.  A very nice study of the gas phase in bioreactors by Christian Sieblist and colleagues from Roche bears out this trend.

Practitioners report that successful bioreactor operation and adequate control over both O2 and CO2 (and hence pH) depends strongly on agitation in the case of O2 and gas flow rate in the case of CO2.  In fact, it's a spectrum and kLa and gas flow rate may both be somewhat important for both responses and the particular combination of kLa and gas flow (Qgas) determines the sensitivities for both gases.

We made some response surface plots from a series of gassing out simulations to illustrate.  These show the final amount of dissolved gas in solution at the end of each experiment, when kLa and Qgas are varied systematically in a 'virtual DOE'.  The initial liquid contained no O2 and some dissolved CO2 that was stripped during the experiment; the gas feed was air, so that dissolved O2 increased during the experiment.

Dissolved O2 at the end of a set of kLa measurement experiments in which kLa and Qgas were varied. The final O2 concentration is always sensitive to kLa and only sensitive to Qgas at very low gas flow rates. 

Dissolved CO2 at the end of a set of kLa measurement experiments in which kLa and Qgas were varied. The final CO2 concentration depends only on Qgas at low gas flows; and is sensitive to kLa only at relatively high gas flows. 

Transient concentrations of O2 and CO2 at low gas flow respond differently to changes in kLa.  In this illustration kLa has been increased between runs from 7 1/hr (dashed line) to 21 1/hr (solid line). The dissolved oxygen profile responds but the CO2 profile remains unchanged (click to enlarge).  Clearly, kLa(CO2) cannot be inferred from these data.

Wednesday, January 27, 2021

Dynochem biologics model library released

Many thanks to customers who engaged with Scale-up Systems as we "built, broke and bettered" our biologics model library in the run-up to release late last year.

More than one hundred biopharmaceutical companies in the Scale-up Suite global user community can now access the tools for immediate use here (https://dcresources.scale-up.com/?q=bio).  An overview of the biologics library is available here.

We expect each tool to grow and be refined by the repeated use that is typical of customer activity and we look forward to supporting more users in taking up the tools in their daily work.

Much like the small molecule opportunity, mechanistic modeling has great potential to accelerate the development of large molecules by shortening development time, making best use of experiments and anticipating manufacturing challenges.  Ours is the first fit-for-purpose and comprehensive mechanistic model library to be built and released in this space, another first of which we are very proud.

Using the Dynochem biologics library delivers daily benefits in development and scale-up while creating digital twins to support your digitalization strategy

Training opportunities using the new tools will be available at regular intervals this year.  Let us know if you'd like a dedicated session for your company or site.

Feel free to share this post with anyone you think may benefit.

Tuesday, December 1, 2020

Digital Tech Transfer using the Dynochem Vessel Database

The pharma industry practice of 'process fit', which allows the manufacture of most products by re-using existing physical assets, raises the perennial question of whether a given process running well at Lab A or Site B can also be run well at Site C.  Anyone who cooks or bakes even occasionally in their own kitchen will know that equipment dimensions and operating conditions affect product quality (and cycle time) and the same is true at manufacturing scale.

This problem used to be handled with a 'boots on the ground' approach, where extensive air travel and time on site allowed detailed oversight, some costly experimentation and tweaks locally before manufacturing.  With a large portion of manufacturing now contracted out to CDMOs, tech transfer remains challenging unless you have the right tools.

Working with over 100 companies engaged in the development and manufacture of pharmaceuticals, we get an up-close look at the issues, challenges and opportunities around tech transfer.  Probably the single biggest factor that makes our tools indispensable to accelerate this work is the Dynochem Vessel Database.

Users like to achieve 'equivalence' between equipment performance at the transferring and receiving sites.  Equivalence may sound simple but the different scaling laws that apply to mixing, heat transfer, solids suspension and mass transfer make this complex; and that's before even considering meso-mixing and micromixing.  Apparently inconsequential differences that are easy to miss, such as materials of construction, heat transfer fluids, impeller types, sizes and positions and even feed locations can have a large impact on performance at the receiving site.  

The likelihood of Right First Time tech transfer increases dramatically with a sufficiently detailed Vessel Database that accurately stores the configuration of site equipment.  Link that with the recipe of the target process, our equipment calculators and peer-reviewed physical properties from our Materials System and you can perform Digital Tech Transfer quickly and accurately without leaving your desk.

If you haven't already created the Vessel Database for your site or wider organization, you can start here from our template.  It's an ideal project for a young engineer and once done correctly, saves time for everyone on the team.

Selection of 'impeller' types in the Dynochem Vessel Database; users may also add custom impellers and internals

Thursday, February 20, 2020

Ed Paul

We were sorry to hear recently that Ed Paul has died.

On a personal level, we shared a lot of laughs and discussions at meetings and conferences of the North American Mixing Forum.

Professionally, Ed was the lead author of the Handbook of Industrial Mixing and before that had an outstanding chemical engineering career with Merck.  Ed's observations of mixing effects on homogeneous reactions spawned a whole new field of research and ultimately led to understanding of phenomena such as micromixing and mesomixing.
Ed's 1971 paper following his PhD thesis spawned a whole new field of chemical engineering research
Scale-up Systems was delighted to host Ed in Dublin for a few days in August 2002, when he shared his experiences of Pharmaceutical chemical development and scale-up and delivered extensive notes that we used to strengthen our model library and knowledge base for customers.
Some notes from Ed's consulting visit to Scale-up Systems in Dublin, 2002
Ar dheis Dé go raibh a anam.

Thursday, July 19, 2018

Great set of guest webinars so far this year, more to come, including 'Bourne' sequel; enjoy on your phone

We hope you've been enjoying our free to attend guest webinar program this year as much as we have.

To date in 2018, Syngenta, Johnson Matthey, Nalas, Amgen and Teva have covered topics from one end of a manufacturing stage to the other, addressing synthesis, experimental design, process safety, crystallization and drying.

Who needs Netflix and HBO?  You can enjoy last week's Guest Webinar by Tom Corrie, Syngenta: “Accelerating Active Ingredient Development with Early Stage DynoChem Simulations", and all other webinars in our Guest series, on your smartphone / mobile device, any time of the day or night. [Screenshot from iPhone 8 shown here]

A reminder that you use your phone to both attend live (Adobe Connect app) and/or enjoy recordings (MP4 format, see iPhone screenshot above).  In line with the spirit of GDPR regulations, the identities of our attendees are now anonymized in recordings.

We're impressed by the innovative ways in which users apply our tools and also their openness in discussing process development challenges they face and the solutions they have found.  And there's more to come this year, with Sarafinas Process & Mixing Consulting on use of the legendary 'Bourne Reactions', UCD on continuous crystallization, and AstraZeneca on centrifugation, events all in the schedule.

Thanks to Steve Cropper and Peter Clark of our team for continuing to line up a great annual program.  2019 is already looking good, with Flow Chemistry and Drying webinars already planned.

Tuesday, October 3, 2017

DOE has "virtually no role at all" in Lyophilization

We've been working away for a little while now with a group of customers to develop improved models for Lyophilization.  The fruits of these labours are available as the current Lyo model in DynoChem Resources.  This handles multi-component (e.g. water, acetic acid) freezing (rate-based approach to SLE) and sublimation (rate-based approach to SVE), with pressure-dependent heat transfer, radiation and a sublimation rate that depends on the thickness of the dry product layer.  You can obtain a predictive model for your system using this template and a few key experiments.

In researching the field while putting this model together, among Mike Pikal's excellent writings we found this useful presentation from a meeting in Bologna, 2012 [The Scientific Basis of QbD: Developing a Scientifically Sound Formulation and Optimizing the Lyophilization Process] and our favourite slide from the deck is reproduced below.


We are used to delivering this message in the context of characterizing, optimizing and scaling other unit operations (e.g. reactions, crystallization) and it is no surprise to see that the same principles hold for Lyo.

Download the model to simulate Lyophilization, fit parameters, predict scale-up and optimize. Download the full slide deck for a good introduction to Lyo.

Saturday, July 15, 2017

How to check the mole balance in your HPLC data and build better kinetic models

We've posted before on the topic of fitting chemical kinetics to HPLC data. Some good experiment planning and design can make this much faster, easier and more informative than a retrospective 'hope for the best' attempt to fit kinetics to experiments coming out of an empirical DOE.

Once the data have been collected from one or two experiments, it's time to check the mole balance. That means checking that your mental model of the chemistry taking place (e.g. A>B>C) and to which your DynoChem model will rigorously adhere, is consistent with the data you have collected. There's a nice exercise in DC Resources to take you through this step by step, using chemistry inspired by a reaction on which Mark Hughes and colleagues of GSK have published and presented.


The exercise starts with HPLC area (not area percent) and after correcting for relative responses leads directly to a new insight into the reaction, even before the first simulation has been run.  When the modeling and experiments are done alongside each other and at the same time, such early insight impacts subsequent experiments and makes them more valuable while reducing their number.

We encourage you to take the exercise to learn this important skill and how to build better, more rigorous and more reliable kinetic models.

Sunday, January 22, 2017

Update 100 to feature enhanced DynoChem vessel mixing and heat transfer utilities

Later this month we will make our 100th round of updates to tools and content in the DynoChem Resources website, so that these are available immediately to all of our users worldwide.  It's appropriate that this 'century' of enhancements is marked by a major release of improved vessel mixing and heat transfer utilities, a cornerstone of scale-up and tech transfer for pharmaceutical companies.

We are grateful to the many users and companies who have contributed requests and ideas for these tools and we have delivered many of these in the 2017 release of the utilities. Ten of the new features are listed below, with a 'shout out' to some customers and great collaborators who led, requested or helped:

Power per unit mass (W/kg) design space for lab reactor;
to produce these results, hundreds of operating conditions are simulated within seconds.
 
Power per unit mass (W/kg) design space for plant reactor;
to produce these results, hundreds of operating conditions are simulated within seconds.
Design space may be generated with one click on Results tab; 
hundreds of operating conditions are simulated within seconds.
  1. A new Design space feature has been included in several utilities that calculates process results over a user-defined range of impeller speed and liquid volume.  Hundreds of operating conditions are simulated within seconds.  When applied to both Vessel 1 and Vessel 2, this allows identification of a range of operating conditions in each vessel that lead to similar calculated mixing parameters.  Design space buttons are available on the Results worksheets and produce tables and response surface plots. [with thanks to Andrew Derrick, Pfizer] 
  2. We have enhanced Vessel 1 and Vessel 2 Reports, including the user’s name, the date and the version number of the utility.  Reports now also contain individual impeller power numbers, UA intercept and UA(v) where applicable. [with thanks to Roel Hoefnagels, J&J]
  3. We have extended our standard list of impellers, including the two-bladed flat paddle and a marine propeller [with thanks to Ramakanth Chitguppa, Dr Reddys]
  4. Users can now name, include and define multiple custom/user-defined impellers on the Impeller properties tab; vessel database custodians can define a custom impeller list for use across an organization. [with thanks to Ben Cohen and colleagues, BMS]
  5. Users can easily import their organization’s vessel database (including custom impellers) from a file on the network, Intranet or web site.  This means that all users can apply the latest utilities from DynoChem Resources and there is no need for power users / custodians to make separate copies of the utilities and share them for internal use. [with thanks to Dan Caspi, Abbvie]
    One click imports the organization's vessel database and custom impellers
  6. Unbaffled Power number estimates have been enhanced and made a function of Reynolds number.
  7. We have added calculation of an estimate of the maximum power per unit mass generated by impellers in a vessel, based on calculations related to the trailing vortex produced by the blades. [thanks to Ben Cohen, BMS, Andrew Derrick, Pfizer and Richard Grenville, formerly DuPont]
  8. We have added calculation of torque per unit volume, a parameter sometimes used in systems with higher viscosity and by agitator vendors.
  9. We have added the Grenville, Mak and Brown (GMB) correlation as an alternative to Zwietering for solids suspension with axial and mixed flow impellers [with thanks to Aaron Sarafinas, Dow].
    The Grenville Mak and Brown correlation is a new alternative to Zwietering
  10.  Some worksheets are partially protected to prevent unintended edits by users.  There is no password and protection can be removed using Review>Unprotect sheet.

Wednesday, July 8, 2015

Generate cocrystal ternary phase diagrams to support process design

We love to provide solutions that save customers time.  A good example arises in process and experimental design aimed at formation of cocrystals.

DynoChem already includes tools to support solvent selection for crystallization and these can indicate the effects of solvent choice on API ("A"), coformer ("B") and cocrystal ("AB") solubility, based on a handful of measurements in a few solvents.  We also provide templates for solution-mediated conversion between forms and drug product salt disproportionation in the presence of excipients.

For cocrystals, once solubilities are known, either by measurement or prediction, a DynoChem dynamic model can simulate in a few seconds the time-dependent equilibration of a large set of potential experiments, reducing the need for painstaking and slow lab experimentation.

Figure 1: Process scheme for simulating cocrystallization process; more solid phases may be included as needed

With this model, users can simulate the relative and total amounts of each of the (e.g. three) solid phases that may result from different starting conditions.  Those results can be plotted and summarized on a ternary phase diagram that summarizes the 'regions' of initial composition that lead selectively to formation of the desired phase.

Figure 2: Ternary phase diagram for an example cocrystal system, with a 1:1 cocrystal AB.

Contact support@scale-up.com if you'd like to discuss using these tools, or related applications to enantiomers and other systems.  Thanks to Dr Andrew Bird for providing the above illustrations.  

Monday, June 29, 2015

Sarah Rothstein of Nalas Engineering: Design a continuous flow process using batch lab data

This webinar from our 2014 series features a fine example of using modeling to get insight without committing resources.  Sarah Rothstein and her colleagues at Nalas Engineering used DynoChem to design a continuous process using batch experiments and found optimum operating conditions without running any experiments in the 'flow' system.

Invest 7 minutes to see what good users can do with our tools:


If you'd like instead to see the full version of Sarah's webinar, follow this link to DynoChem Resources.

Friday, June 19, 2015

DynoChem Spray Dryer model calculates thermodynamic Design Space

When planning to select or use a spray dryer in the lab or at larger scale, it's important to know the right operating conditions (feed rate, gas inlet temperature, pressure) to achieve potential critical quality attributes like residual moisture and gas outlet temperature.  You can map your dryer's operating space easily using the DynoChem spray dryer template, reducing your dependence on trial and error to find the right process conditions.


Results can be generated for any solvent system in a few minutes.  You can also fit the heat loss parameter (UA) to better characterize your dryer.  And fit the gas-liquid mass transfer parameter (kLa) if your system does not reach equilibrium.

Friday, January 23, 2015

DynoChem Training Videos - Train Yourself Anytime

We just published today the first 13 in a series of short videos based on our instructor-led training.

You can use these to learn or polish up on your DynoChem skills when you have DC installed and access to the DCR website:


We hope you find these valuable in your work.

Monday, December 15, 2014

Gifts arrive early for DynoChem users with DCR update number 79

Whether or not you celebrate holidays at this time of year, you will enjoy some of the 'gifts' in the monthly DCR Update already delivered this December.  Coming on top of the November changes to the site, which made it accessible on all devices, update number 79 on 10 December 2014 included delivery of:

  • One-click screening of solvent mixtures for synergistic peaks in solubility (see screenshot below); you can think of this as a solubility dashboard - very helpful for crystallization process design / solvent selection, as well as for chemists selecting solvents for reactions
  • Easy solvent swap/switch simulation in the presence of 4 solvents and a non-volatile solute; this release includes more flexibility in defining end-point composition targets and setting jacket temperature during distillation
  • Updates to a series of our 'simple' reaction models; these are now in the new standard format, with Start here tab, Help and process scheme included, with clear documentation of user inputs and model outputs.  These features are very popular with users that have been away from DynoChem for a little while and need a quick refresher before starting a new project
  • Another enhancement in our reaction calorimetry / process safety training - an exercise about generating stronger and more accurate safety statements using TMR (time to maximum rate) response surfaces.
Automated solvent screen*: This enhancement was promised in our paper on solubility at the AIChE Annual Meeting in November, which is now also available to download from DCR.  

We hope that you can find time to review these and other enhancements to our model library and as always would love to hear your feedback via any communications channel that is convenient for you.

* In deference to our many users still operating on Excel 2007 or older, we decided to implement this feature using standard Excel plots for visualization (rather than Sparklines, which require Excel 2010 at your end).  


Thursday, July 24, 2014

DynoChem July update featured applications in heat flow (Qr) and crystallization

We update our online model library every month and summarize the changes in the WhatsNew document.  Each update makes the latest tools and improvements available to all users immediately.

In July, we continued our work to simplify tools and make them easier to apply, focusing on models that work with heat flow (Qr-Qb) data and on crystallization operations.  Over the next 6 months, other application areas will receive the same review and enhancement.

We are fortunate to have Dr Wilfried Hoffmann in our team, who after nearly 29 years at Pfizer, with responsibilities and expertise ranging from thermochemistry to PAT and modeling, joined our team in 2012.  Wilfried led the review of the heat flow models and the changes reflect his experience and expertise.  Simple models allow rapid estimation of kinetics with very little input data and separate models translate the chemistry (by copy and paste) to larger scale conditions.  Search for 'Qr' and 'exotherm' in the DCR search box to find these tools.

Decomposition reactions can be included easily alongside the synthetic chemistry reactions and safety scenarios can be explored to minimise 'accumulation' or maximize the time to maximum rate (TMR) after a cooling failure.  Many of you will have seen the 2013 webinar by Bernhard Berger of Siegfried in this application area; if not, it is well worth your time to review.

The crystallization library was also enhanced with a clearer workflow among the various tools involved and consistent, rigorous kinetics applied across all models.  The previous blog post highlighted some excellent results achieved using these models, using Lasentec (CLD) data to obtain the kinetics of the true crystal size distribution (CSD), taking account of particle shape.

There will be webinars in both application areas later this year to review the improvements.  See the list of current events anytime by visiting here.

Monday, May 26, 2014

Franjo Jovic: Modeling approach to process development for hydrogenation step


The above links to an extract from the DynoChem guest webinar last week by Dr Franjo Jovic of Pliva (part of Teva group). Franjo talked about how the design space for an API hydrogenation reaction step was defined using DynoChem and model predictions verified with experimental results.

The full version of the webinar is available here.

Friday, April 4, 2014

Get a snapshot overview of your model using List All Phases in Simulator

A tip from the DynoChem support and training team.

When working with a DynoChem model in the Simulator window, you will often find it worthwhile to use the List All Phases dialog (click the process scheme icon highlighted in the toolbar) to see everything that's going on, in tabular form, at any given moment during the simulation:

This display shows all of your phases and rates, including lots of variables that may not be plotted in your simulation chart window but may be useful to know.

You can also use the slider bar at the bottom of the table to dial forward and back in time.

With just another few keystrokes, you can use that table to make a quick report (or several) in Excel that captures the whole state of the model.  As is so often the case when working with DynoChem, just copy and paste:

We hope that you find this tip helpful in making the most of and reporting on your simulations.

Wednesday, February 19, 2014

New DynoChem Solvent Swap Distillation Tool went live today: webinar Tuesday 25 Feb

You may know it as "solvent switch", "solvent swap", "solvent exchange", "strip and replace", "feed and bleed" or any number of other names; the fact is,  if you make pharmaceutical intermediates or APIs, you are doing this in almost every manufacturing stage, sometimes more then once.

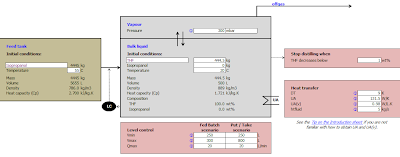
Good news then that the DynoChem solvent swap distillation tool has been made even easier and faster to use with today's online library update, including a brand new simple interface that requires no DynoChem knowledge to drive:


Now you can find out how many volumes are needed, how much time it will take, which vessel to select and what the composition trajectory will be, in even less time than before.

Next week there is a great opportunity for a refresher on solvent swap, as our Chemical Engineering webinar series features this topic in both of Tuesday's sessions.  Attend live if you can; register to make sure you receive a link to the recording.

If you're new to the area, there some more good background information on solvent swap here.

Tuesday, January 7, 2014

Begin with the end in mind: how to obtain equivalent results at different scales


The impact of physical processes on the performance of manufacturing operations is well known.  Good accounts of the basic problem are available in many textbooks, such as that of ZlokarnikAtherton & Carpenter and many more. Regulators understand this too, with the word 'scale' appearing 25 times in ICH Q11, with statements like "The development ... should account for scale effects and be representative of the proposed commercial process".

It is remarkable then that much airtime is given to laboratory scale statistical design of experiments as a vehicle for efficient process development, without adequate discussion of how the DOE results can be made scalable.  The good news for the drug substance / API synthesis community is that the necessary concepts for scalability are well established and can be put into practice with DynoChem software tools that are easy to use.   You can for example achieve equivalent 'mixing' between 100 mL and 1500 L reactors, or match addition times / cooling rates between lab and plant, by investing 15 minutes of your time.  Doesn't that beat having to deal with missed deadlines or increased impurity levels on scale?  And the associated process rework?

We made a carton animation to raise awareness of the problem and the opportunity.  If you see the potential, sign up for DynoChem access.

Friday, December 6, 2013

DynoChem Resources Update 67: Calculate vortex shape and baffle effects in vessel mixing utilities

Update 67 in November 2013 focused on the DynoChem mixing / vessel utilities, enhancing them to include detailed definition of baffle type and number and the associated calculations of vortex shape, wetted area and agitator power. To find out more:

• Download the KB Article describing the new calculations of vortex shape and baffle effects in the vessel / mixing utilities:https://dcresources.scale-up.com/Default.aspx?id=364
• Watch the recorded webinar: http://dcresources.scale-up.com/Recording.aspx?id=932


ShareThis small