Showing posts with label DOE. Show all posts

Saturday, April 24, 2021

Get ready for Dynochem 6 and Scale-up Suite 2: Modeling for Everyone

Last week, Peter Clark gave a preview of new features coming with Scale-up Suite 2.  If you missed the event live, as usual you can catch the recoding in the resources site here.

Peter showed there is something for everyone in the new release.  Whatever modality of drug/ active ingredient you develop or make, whether a small or large molecule or somewhere in between, whether made with cell culture or synthetic organic chemistry, your teams and your enterprise can obtain value daily from our tools.  That takes us several steps closer to our vision to positively impact development of every potential medicine.

Scale-up Suite 2 includes:

  • Powerful equipment calculators for scale-up, scale-down and tech transfer, leveraging our industry standard vessel database format
  • Rigorous material properties calculators for pure components, mixtures and your proprietary molecules
  • Empirical / machine learning tools, to build and use regression models from your data with just a few clicks; including support for DRSM
  • Mechanistic modeling of any unit operation, in user-friendly authoring and model development environments
  • Hybrid modeling, combining the best of both worlds
  • Interactive data visualization, including parallel coordinates and animated contour plots for multidimensional datasets
  • New features to make modeling faster, more productive and more enjoyable, incorporating ideas suggested by customers and from our own team
  • New capabilities for autonomous creation of models, parameter fitting and process optimization 'headless' on the fly, as well as incorporation of real time data and access from any device.
We believe that:
  • Interdisciplinary collaboration accelerates process development and innovation
  • Models facilitate collaboration and knowledge exchange
  • Interactive, real-time simulations save days and weeks of speculation
  • Models are documents with a lifecycle extending from discovery to patient
  • Model authoring tools must be convenient and easy to use
  • Teams needs models that are easily shared
  • Enterprises need tools that embed a modeling culture and support wide participation.
In other words, modeling should be an option for Everyone.  To make that a reality for you, we support our software tools with:

  • an Online Library, containing hundreds of templates, documentation and self-paced training
  • Free 1-hour on-line training events monthly
  • Half-day and full day options for face to face training, available globally
  • A free certification program to formally recognize your progress and skills
  • Outstanding user support from PhD qualified experts with experience supporting hundreds of projects like yours
  • A thriving user community, with round tables and regular customer presentations sharing knowledge and best practices.

We're celebrating 21 years serving the industry this year, supporting more than 20,000 user projects annually, for more than 100 customers all over the world, including 15 of the top 15 pharma companies.

If you're an industry, academic or regulatory practitioner, we invite you to join our user community and start to reap the benefits for your projects.

Thursday, July 11, 2019

Part 5 of 6: Opportunities to accelerate projects

You may already know that the most commonly used noun in the English language is "time".  In today's world, many of us feel almost permanently under time pressure and we talk about not having enough time for all kinds of things we'd like to do.  Not having time takes on a whole new meaning for patients with life changing medical conditions, reminding us in chemical development and scale-up that opportunities to accelerate our work and commercialization of new medicines should be taken with both hands.

Achieving acceleration using modeling (e.g. Dynochem or Reaction Lab) is already well covered by extensive case studies from customers in Dynochem Resources.  Acceleration using automation of modeling and connection of modeling to other workflows is the subject of this post.  In our core software development team, we have thought a  lot about these future applications and taken steps to support their realization, providing a platform and the ‘hooks’ needed to link with other technologies.

A basic platform is the ability to automatically generate and run a large number of virtual experiments.  We use parallel processing to execute the simulations as illustrated in the short animation below.  The automation calls are exposed and may be 'scripted' and run by other programs (e.g. Python) as part of an integrated workflow.
Chemists and engineers can leverage automated generation and execution of a large set of virtual experiments with parallel processing and collation of results in convenient Excel tables and contour plots.
Tasks involved in model building may also be scripted/ automated in Dynochem 5 and Reaction Lab.  For example, area percent data may be entered in a model, a set of kinetic parameters fitted and many simulations carried out, all without human intervention.  To do this requires some scripting / code at several stages in the workflow.  Cloud computing resources (Azure or AWS) may be used for execution, leveraging our cloud licensing.

For example, the animation below shows scripted fitting of three UA (heat transfer characterization) values to three solvent tests using Dynochem 5.  This takes a short time to fit the parameters needed for each of three liquid levels in a reactor.  (The ‘fit’ button is just for demo purposes and normally the fit would be started from another scripted workflow process).
Scripted parameter fitting is possible using new function calls built into Dynochem 5 and Reaction Lab; this example illustrates automated heat transfer characterization (UA) and the techniques are equally applicable to e.g. chemical kinetics.
Additional opportunities exist in leveraging information from electronic lab notebooks (ELN) to create models for users that are already populated with features such as chemical structures and experimental data.  In a move beyond existing relatively crude self-optimizing reactor algorithms, customers are interested in closing the loop between modeling and experimentation, using model outputs to set up and execute the next experiment(s) in a fully automated loop.

Contact our support team if you'd like to discuss any of these applications further for use inside your organization.

Friday, June 7, 2019

Part 4 of 6: Where will the models come from?

If mechanistic modeling is to become a focal point in the project lifecycle, you have to address the question of where the models will come from.  In this context, by 'model' we mean i) the set of equations to be solved, ii) in executable form, with iii) initial values, iv) fitted parameter values where needed and v) experimental data to assess model accuracy.

Q: Who can create these models and when does it make sense for them to do so?
A: For tangible benefits the creators and users should be the same practitioners / project teams that own and run the development projects.  Not some specialists in an ivory tower that are focused only on modeling.  Model development should occur before and during experimentation.  Modeling should not be a 'post-processing' activity that occurs too late to add value or when the time window for data collection has passed.

In Dynochem 5 and Reaction Lab, we have streamlined the process in i) to v) so that this vision is achievable.  We include further notes on the individual steps below.

Steps i) to v) can be accomplished in a snap for chemical reactions using Reaction Lab.  The resulting model can be leveraged over and over during the project lifecycle.
Item (i) may be clear and simple for certain common unit operations like heating/ cooling and perhaps filtration; for many other operations, identifying which equations to solve may be iterative and challenging.  For models of fairly low complexity, like distillation, while the equation set may be obvious it is unwieldy to write down for multi-component systems including the energy balance.  For models of chemical reactions, the set of elementary reactions will not become clear until the full cycle i)-v) has been repeated more than once by knowledgable process chemists.

Unlike some other tools, we do not force users to populate 'matrices' just to define reactions and reaction orders (!)

Item ii) is an obstacle for practitioners who only have access to spreadsheets, or specialized computing/coding environments.  These force the user to develop or select a specific solution method and run risks of significant numerical integration inaccuracies.  Even then, simulations will lack interactivity and parameter estimations will require scripting or complex code.  Some 'high-end' engineering software tools present similar challenges, lacking comprehensive model libraries and forcing users to write custom models, delve into solution algorithms and confront challenges such as 'convergence' that feel highly tangential to project goals.

Item iii) should be easy for practitioners and in practice it can be so, if the software supports flexible units conversion (in and out of SI units) and contains supporting tools to provide initial estimates of physical properties and equipment characteristics.

Item iv) requires the model to be run many times and compared with experimental results.  Specialized algorithms are needed to minimize the gap between model predictions and experimental data.  When multiple parameters must be fitted to multiple responses in multiple experiments, this gets close to impossible in a spreadsheet model and general-purpose mathematical software environments.

Item v) is mainly the province of the experimenter and once each experiment has been completed, requires an easy mechanism for aggregating the data, with flexible units handling (including HPLC Area, Area%) being a major help.

And so to answer the question in the title of this post: You guessed it!  We expect the majority of chemical reaction and unit operation models in Pharma to continue to be developed using our tools in preference to home-made or overly complex environments.  As the volume of modeling activity grows with Industry 4.0 and related developments, we already see this trend becoming more pronounced, with many practitioners needing to use the same model over a project lifecycle, requiring speed and ease of use as well as accuracy and rigour.

Friday, May 10, 2019

Post 3 of 6: Central role of mechanistic modeling in Chemical Development

Chemical Development is a complex and challenging undertaking, involving a large effort from multi-disciplinary teams, sometimes battling Mother Nature, with compressed timelines and limited material for experimentation.  There is a broad spectrum of approaches to this challenge, including new lab instruments, use of robotics and automation, outsourcing certain types of development or operations and use of statistical and mechanistic modeling.  Companies also experiment to find the best organization structure for this function and frequently separate departments specialize in Analytical (Chemistry) Development, Chemical (Process) Development, Technology Transfer and preparation of Regulatory filings.  Collaboration among these groups helps achieve development goals.

Figure 1 (click to enlarge): A simplified representation of chemical development today, including the scale and locus of statistical and mechanistic modeling
Figure 1 is a much simplified graphical representation of the activities involved.  There is a large reliance on experiments.  Groups involved in process definition and optimization are currently the main users of both statistical and mechanistic modeling.  Technology transfer increasingly involves working with external partners remotely.  Data search and gather, including data integrity reviews and preparation of regulatory filings, are mostly manual processes.  The disparate nature of activities and the needs for specialization make them somewhat siloed, with risks of duplication and dilution of effort.  For example, an experimental program may be repeated if the first program missed some key information; or repeated by a CRO to answer new questions that have arisen; or repeated by a CMO in order to accomplish successful tech transfer.  None of these data may be harnessed effectively and shared to answer future questions.

Leading companies are changing their approach to chemical development and bringing mechanistic process modeling on stream earlier and more centrally than before.  The idea is not new but advances in a range of technologies (see earlier posts) and the momentum of 'Industry 4.0' are helping to fuel the transformation.  At a task level, using a model to design the right experiments reduces overall effort.  At a project level, the model provides a place to capture the knowledge and reuse it in future.  At an organization level, modeling provides a structured, reusable and digital approach to information sharing and retrieval.  For example, questions can be answered in real time, without experimentation, interactively when they arise, even live in a meeting or webcon, sparing delays, speculation and doubts, allowing faster progress.

Figure 2 (click to enlarge): Future shape of chemical development activities, with mechanistic process models as the focal point for information capture and reuse.
The pieces in Figure 1 are rearranged in a natural way in Figure 2 as a cycle that captures and makes the most of information generated during each chemical development activity, including modeling.  Additional items have been added to reflect technologies that are relatively new to Pharma, including continuous manufacturing and feedback process control; opportunities to apply either or both of these in chemical development or full scale manufacturing can be evaluated using a mechanistic process model.  Therefore the mechanistic model takes up a central position and is the focal point in the new chemical development process.

It will take some time before Figure 2 reaches its full potential.  The throughput of models in chemical development organizations is already increasing as model building tools become easier to use and more prevalent.  We're delighted to be able to lead the way with Scale-up Suite.

Figure 2 also includes some great opportunities to automate workflows.  We'll discuss some of these in a later post.  

Thursday, July 19, 2018

Great set of guest webinars so far this year, more to come, including 'Bourne' sequel; enjoy on your phone

We hope you've been enjoying our free to attend guest webinar program this year as much as we have.

To date in 2018, Syngenta, Johnson Matthey, Nalas, Amgen and Teva have covered topics from one end of a manufacturing stage to the other, addressing synthesis, experimental design, process safety, crystallization and drying.

Who needs Netflix and HBO?  You can enjoy last week's Guest Webinar by Tom Corrie, Syngenta: “Accelerating Active Ingredient Development with Early Stage DynoChem Simulations", and all other webinars in our Guest series, on your smartphone / mobile device, any time of the day or night. [Screenshot from iPhone 8 shown here]

A reminder that you use your phone to both attend live (Adobe Connect app) and/or enjoy recordings (MP4 format, see iPhone screenshot above).  In line with the spirit of GDPR regulations, the identities of our attendees are now anonymized in recordings.

We're impressed by the innovative ways in which users apply our tools and also their openness in discussing process development challenges they face and the solutions they have found.  And there's more to come this year, with Sarafinas Process & Mixing Consulting on use of the legendary 'Bourne Reactions', UCD on continuous crystallization, and AstraZeneca on centrifugation, events all in the schedule.

Thanks to Steve Cropper and Peter Clark of our team for continuing to line up a great annual program.  2019 is already looking good, with Flow Chemistry and Drying webinars already planned.

Tuesday, February 27, 2018

A PSD trend that is not widely reported - thanks, Orel

While supporting customers who apply DynoChem for crystallization modeling, we have seen several cases where some of the familiar quantiles of the PSD (D10, D50, D90) reduce with time during at least the initial part of the crystallization process.

On reflection one should not be that surprised: these are statistics rather than the sizes of any individual particles.  In fact, all particles may be getting larger but the weighting of the PSD shifts towards smaller sizes (where particles are more numerous, even without nucleation) and in certain cases, this causes D90, D50 and maybe even D10 to reduce during growth.

Last week we had an excellent Guest Webinar from Orel Mizrahi of Teva and Ariel University, who characterized a system with this behaviour, with modeling work summarised in the screenshot below.

D10, D50 and D90 trends in a seeded cooling crystallization: measured data (symbols) and model predictions (curves).
There was a good discussion of these results during Orel's webinar and we decided to make a short animation of a similar system using results from the DynoChem Crystallization Toolbox to help illustrate the effect.
Cumulative PSD from the DynoChem Crystallization toolbox, showing the evolution of PSD shape during growth from a wide seed PSD.  The movement of quantiles D10, D50 and D90 is shown in the lines dropped to the size axis of the curve.
In this illustration, the reduction in  D50 can be seen briefly and the reduction in D90 continues through most of the process.  From the changing shape of the curve,  with most of the movement on the left hand side, most of the mass is deposited on the (much more numerous) smaller particles.

We see this trend even in growth-dominated systems, when the seed PSD is wide.

Wednesday, January 24, 2018

Run typical crystallization experimental design in silico using DynoChem

Faced with challenging timelines for crystallization process development, practitioners typically find themselves running a DOE (statistical design of experiments) and measuring end-point results to see what factors most affect the outcome (often PSD, D10, D50, D90, span).  Thermodynamic, scale-independent effects (like solubility) may be muddled with scale-dependent kinetic effects (like seed temperature and cooling rate or time) in these studies, making results harder to generalize and scale.

First-principles models of crystallization may never be quantitatively perfect - the phenomena are complex and measurement data are limited - but even a semi-quantitative first-principles kinetic model can inform and guide experimentation in a way that DOE or trial and error experimentation can not, leading to a reduction in overall effort and a gain in process understanding, as long as the model is easy to build.

Scale-up predictions for crystallization are often based on maintaining similar agitation and power per unit mass (or volume) is a typical check, even if the geometry on scale is very different to the lab.  A first principles approach considers additional factors such as whether the solids are fully suspended or over-agitated, how well the heat transfer surface can remove heat and the mixing time associated with the incoming antisolvent feed.

The DynoChem crystallization library and the associated online training exercises and utilities show how to integrate all of these factors by designing focused experiments and making quick calculations  to obtain separately thermodynamic, kinetic and vessel performance data before integrating these to both optimize and scale process performance.

Users can easily perform an automated in-silico version of the typical lab DOE in minutes, with 'virtual experiments' reflecting performance of the scaled-up process.  Even if the results are not fully quantitative, users learn about the sensitivities and robustness of their process as well as its scale-dependence.  This heightened awareness alone may be sufficient to resolve problems that arise later in development and scale-up, in a calm and rational manner.  Some sample results of a virtual DOE are given below by way of example.

Heat-map of in-silico DOE at plant scale agitation conditions, showing the effects of four typical factors on D50
The largest D50 is obtained in this case with the highest seeding temperature,  lowest seed loading and longest addition (phase 1) time. Cooling time (phase 2) has a weak effect over the range considered.
Click here to learn how to apply these tools.

Thursday, December 21, 2017

Congratulations to Dr Jake Albrecht of BMS: Winner of AIChE QbD for Drug Substance Award, 2017

At AIChE Annual Meetings, Monday night is Awards night for the Pharma community, represented by PD2M.  This year in Minneapolis the award for Excellence in QbD for Drug Substance process development and scale-up went to Dr Jake Albrecht of Bristol-Myers Squibb.  Congratulations, Jake!


Winners are selected using a blinded judging panel selected by the Awards Chair, currently Bob Yule of GSK.  Awards criteria are:
  • Requires contributions to the state of the art in the public domain (e.g. presentations, articles, publications, best practices)
  • Winner may be in Industry, Academia, Regulatory or other relevant working environment
  • Winner may be from any nation, working at any location
  • There are no age or experience limits
  • Preference is given to work that features chemical engineering
Jake was nominated by colleagues for:
  • his innovative application of modeling methodologies and statistics to enable quality by design process development
  • including one of the most downloaded papers in Computers and Chemical Engineering (2012-2013), “Estimating reaction model parameter uncertainty with Markov Chain Monte Carlo
  • his leadership and exemplary efforts to promote increasing adoption of modeling and statistical approaches by scientists within BMS and without
  • his leadership in AIChE/PD2M through presentations, chairing meeting sessions, leading annual meeting programming and serving on the PD2M Steering Team
Scale-up Systems was delighted to be involved at the AIChE Annual Meeting this year in our continued sponsorship of this prize.  Some photos and video from the night made it onto our facebook page and more should appear soon on the PD2M website.

Jake is also a DynoChem power user and delivered a guest webinar in 2013 on connecting DynoChem to other programs, such as MatLab.

Wednesday, November 29, 2017

November 2017 DynoChem Crystallization Toolbox Upgrade

We're delighted that the number of DynoChem users getting value from our crystallization tools continues to grow strongly and we're grateful for the feedback and feature requests they provide to help us improve the tools.

New features released this November include:
  • One-click conversion of kinetic model into predictor of the shape of the PSD
  • High-resolution tracking of the distribution shape, to minimize error*
  • Extended reporting and plotting of PSD shape.

Sometimes practitioners that are unaware of crystallization fundamentals, crystallize too fast and with little attention to the rate of desupersaturation.  For such a rushed process, even when seeded (2%) the operating lines might look like the picture on the left below (Figure 1). A more experienced practitioner might operate the crystallization as shown on the right (Figure 3):

The particles produced by these alternatives differ greatly in size.  The rushed crystallization leads to a multimodal distribution (red in Figure 2) with low average size, due to seeded growth and separate nucleation events during both antisolvent addition and natural cooling.  These crystals will be difficult to filter and forward-process.

More gradual addition, with attention to crystallization kinetics and both the addition and cooling rates, leads to larger crystals (blue in Figure 2) and a tighter distribution that can be further enhanced by optimizing seed loading, seeding temperature and the operating profiles.

From November 2017, these types of scenarios can be set up, illustrated and reported in minutes using the DynoChem Crystallization Toolbox.


* We have implemented high resolution finite volume discretisation of the CSD, using the Koren flux limiter.

Tuesday, October 3, 2017

DOE has "virtually no role at all" in Lyophilization

We've been working away for a little while now with a group of customers to develop improved models for Lyophilization.  The fruits of these labours are available as the current Lyo model in DynoChem Resources.  This handles multi-component (e.g. water, acetic acid) freezing (rate-based approach to SLE) and sublimation (rate-based approach to SVE), with pressure-dependent heat transfer, radiation and a sublimation rate that depends on the thickness of the dry product layer.  You can obtain a predictive model for your system using this template and a few key experiments.

In researching the field while putting this model together, among Mike Pikal's excellent writings we found this useful presentation from a meeting in Bologna, 2012 [The Scientific Basis of QbD: Developing a Scientifically Sound Formulation and Optimizing the Lyophilization Process] and our favourite slide from the deck is reproduced below.


We are used to delivering this message in the context of characterizing, optimizing and scaling other unit operations (e.g. reactions, crystallization) and it is no surprise to see that the same principles hold for Lyo.

Download the model to simulate Lyophilization, fit parameters, predict scale-up and optimize. Download the full slide deck for a good introduction to Lyo.

Wednesday, August 23, 2017

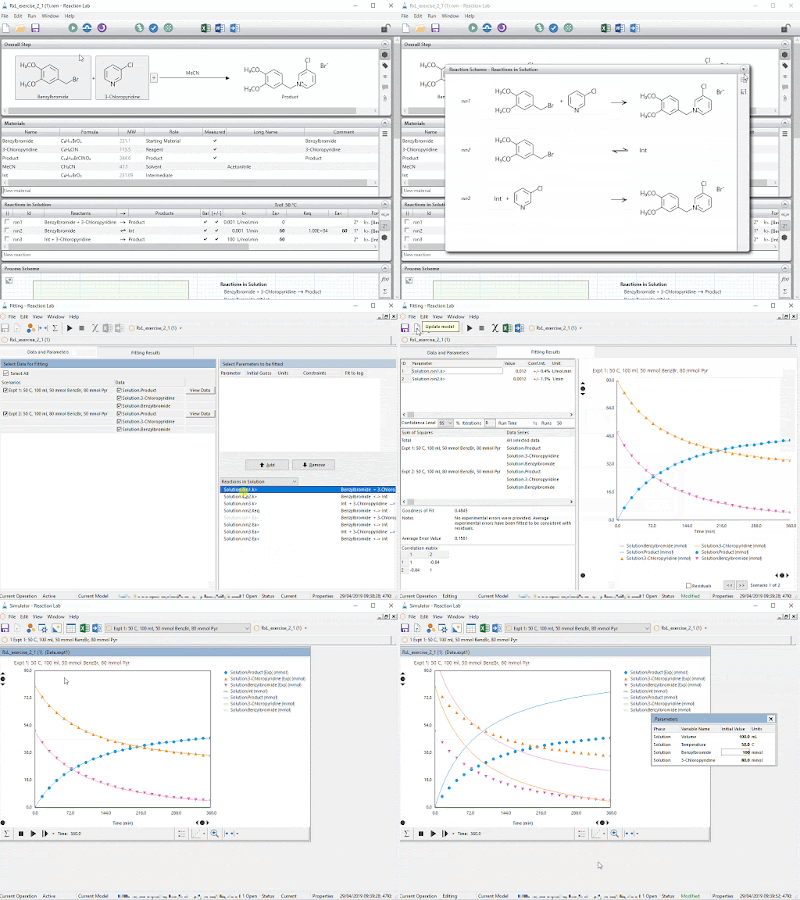
Finding the rate law / reaction mechanism: exercise shows the way

We highly recommend that chemists and engineers involved in kinetic modeling take our dedicated exercise that focuses on determining the correct rate law.

In DynoChem's Fitting window, it is easy to quickly try different parameter fitting options and especially select different groups of parameter to fit. When confronted with new data, models can be adapted and further developed, in this case to better capture the reaction mechanism.

This exercise takes you through that workflow using  the Menschutkin reaction of 3,4-dimethoxybenzyl bromide and 3-chloro-pyridine:


A handful of well-controlled experiments followed by sampling together with use of the DynoChem Fitting window allows the single-line reaction to be broken out into a series of elementary steps that better represent the chemistry.  On this foundation, users build a model suitable for reaction optimization and scale-up, saving unnecessary experiments and providing a sound basis for process decisions.

Go on - take 20 minutes to give it a try.  Then share the link with your colleagues so they can start saving time on their development projects.

Saturday, July 15, 2017

How to check the mole balance in your HPLC data and build better kinetic models

We've posted before on the topic of fitting chemical kinetics to HPLC data. Some good experiment planning and design can make this much faster, easier and more informative than a retrospective 'hope for the best' attempt to fit kinetics to experiments coming out of an empirical DOE.

Once the data have been collected from one or two experiments, it's time to check the mole balance. That means checking that your mental model of the chemistry taking place (e.g. A>B>C) and to which your DynoChem model will rigorously adhere, is consistent with the data you have collected. There's a nice exercise in DC Resources to take you through this step by step, using chemistry inspired by a reaction on which Mark Hughes and colleagues of GSK have published and presented.


The exercise starts with HPLC area (not area percent) and after correcting for relative responses leads directly to a new insight into the reaction, even before the first simulation has been run.  When the modeling and experiments are done alongside each other and at the same time, such early insight impacts subsequent experiments and makes them more valuable while reducing their number.

We encourage you to take the exercise to learn this important skill and how to build better, more rigorous and more reliable kinetic models.

Sunday, January 22, 2017

Update 100 to feature enhanced DynoChem vessel mixing and heat transfer utilities

Later this month we will make our 100th round of updates to tools and content in the DynoChem Resources website, so that these are available immediately to all of our users worldwide.  It's appropriate that this 'century' of enhancements is marked by a major release of improved vessel mixing and heat transfer utilities, a cornerstone of scale-up and tech transfer for pharmaceutical companies.

We are grateful to the many users and companies who have contributed requests and ideas for these tools and we have delivered many of these in the 2017 release of the utilities. Ten of the new features are listed below, with a 'shout out' to some customers and great collaborators who led, requested or helped:

Power per unit mass (W/kg) design space for lab reactor;
to produce these results, hundreds of operating conditions are simulated within seconds.
 
Power per unit mass (W/kg) design space for plant reactor;
to produce these results, hundreds of operating conditions are simulated within seconds.
Design space may be generated with one click on Results tab; 
hundreds of operating conditions are simulated within seconds.
  1. A new Design space feature has been included in several utilities that calculates process results over a user-defined range of impeller speed and liquid volume.  Hundreds of operating conditions are simulated within seconds.  When applied to both Vessel 1 and Vessel 2, this allows identification of a range of operating conditions in each vessel that lead to similar calculated mixing parameters.  Design space buttons are available on the Results worksheets and produce tables and response surface plots. [with thanks to Andrew Derrick, Pfizer] 
  2. We have enhanced Vessel 1 and Vessel 2 Reports, including the user’s name, the date and the version number of the utility.  Reports now also contain individual impeller power numbers, UA intercept and UA(v) where applicable. [with thanks to Roel Hoefnagels, J&J]
  3. We have extended our standard list of impellers, including the two-bladed flat paddle and a marine propeller [with thanks to Ramakanth Chitguppa, Dr Reddys]
  4. Users can now name, include and define multiple custom/user-defined impellers on the Impeller properties tab; vessel database custodians can define a custom impeller list for use across an organization. [with thanks to Ben Cohen and colleagues, BMS]
  5. Users can easily import their organization’s vessel database (including custom impellers) from a file on the network, Intranet or web site.  This means that all users can apply the latest utilities from DynoChem Resources and there is no need for power users / custodians to make separate copies of the utilities and share them for internal use. [with thanks to Dan Caspi, Abbvie]
    One click imports the organization's vessel database and custom impellers
  6. Unbaffled Power number estimates have been enhanced and made a function of Reynolds number.
  7. We have added calculation of an estimate of the maximum power per unit mass generated by impellers in a vessel, based on calculations related to the trailing vortex produced by the blades. [thanks to Ben Cohen, BMS, Andrew Derrick, Pfizer and Richard Grenville, formerly DuPont]
  8. We have added calculation of torque per unit volume, a parameter sometimes used in systems with higher viscosity and by agitator vendors.
  9. We have added the Grenville, Mak and Brown (GMB) correlation as an alternative to Zwietering for solids suspension with axial and mixed flow impellers [with thanks to Aaron Sarafinas, Dow].
    The Grenville Mak and Brown correlation is a new alternative to Zwietering
  10.  Some worksheets are partially protected to prevent unintended edits by users.  There is no password and protection can be removed using Review>Unprotect sheet.

Monday, May 9, 2016

New DynoChem cooling and antisolvent crystallization toolbox released

We were delighted to release in April our new crystallization process design toolbox, having spent much of 2015 working with customers to better define requirements and piloting the toolbox as it developed in several live sessions.

Inspired by the user interface of our successful solvent swap model, the Main Inputs tab serves as a dashboard for designing and visualizing your crystallization process.

You can get a good intro to the toolbox from the preview webinar we recorded in January 2016.  In short, we combined several of our popular crystallization utilities, enhanced them and then automated the building of a crystallization kinetic model in the background.  That model is ready to use for parameter fitting and detailed process predictions if you have suitable experimental data.

As you might expect, you can generate a solubility curve within seconds of pasting your data.  You can also make quick estimates of operating profiles (cooling and/or addition) for controlled crystallization.  And you can estimate the final PSD from the seed PSD and mass.  That's all within a few minutes and before using the kinetic model.

The toolbox supports both design of experiments (helping make each lab run more valuable) and design of your crystallization process, especially in relation to scale-up or scale-down.  There's a dedicated training exercise that walks you through application to a new project.

We'd be delighted to hear your feedback in due course.

Friday, January 1, 2016

Use these links to get Advice, Guidance and Help as you apply our tools in 2016

Are you managing a team that works in process development and scale-up?  Or working at the coalface applying our tools on a regular basis?  Or perhaps you're a former DynoChem user whose modeling exploits have helped lead to rapid promotion :) and it's been a while since you last visited us?

Either way, you should find the following links interesting and useful as you start the new year of 2016.
  • For general advice on topics in process development and scale-up, use the 'advice' search string in DynoChem Resources, or click this link: https://dcresources.scale-up.com/?q=advice  
  • One document that appears in this list has some new additions including a list of typical values for process parameters and a list of recommended text books for your department library.
  • To get a helicopter view and roadmap about how to apply our software in a specific area, search instead for 'guidance' or click https://dcresources.scale-up.com/?q=guidance
  • The solid-liquid separation guidance has been updated recently to help define how to set up a lab filtration rig, thanks to publications by customers such as BMS and Amgen:
Of course you can share all of these links with your team and colleagues by email and otherwise.

And we'd love to get both your and their feedback in due course so that we can improve our tools for the benefit the whole process development and scale-up community.

Wednesday, October 14, 2015

Try attending our webinars on your phone / other mobile device

Short version:
  1. At meeting time, open your mobile browser and navigate to our standard meetings page: https://meetings.scale-up.com/joinmeeting
  2. Enter your name (for identification to the meeting host) and click the Join Meeting button as if you were at your PC
  3. Your phone (iOS or Android) will take care of the rest, prompting you to open the Adobe Connect app and Request Entry
  4. Your phone will prompt you to install the app if you don't have it already.
Longer version:

We record all of our webinars so that you can play them back if you miss them live or want a recap. We also convert many of them to MP4s, so you can watch recordings on mobile devices.

It's even better if you can attend live - then you have the chance to put your questions and comments to the speaker, live in the meeting chat pod.

With customers spread all over the world, our events may fall while you are having breakfast, or at the end of your day when you are back home. That's why we've been investigating how well current mobile technology supports meeting attendance on your smartphone.  If that works, you can attend from pretty much anywhere you can get a phone signal.

The good news is that the Adobe Connect app is available for both iOS and Android platforms and this can be downloaded in the App Store or the Play Store.


Remember to register for the webinar in the usual way, so that our meeting facilitator is expecting you. Then at meeting time, open your mobile browser and navigate to our standard meetings page: https://meetings.scale-up.com/joinmeeting; enter your name and click the Join Meeting button as if you were at your PC.  Your phone (iOS or Android) should take care of the rest, prompting you to open the Adobe Connect app and Request Entry.

Important:  Use your full name for identification purposes.

Once admitted to the meeting, you'll enjoy audio and the usual screens like this (all captures taken using an iPhone 5S):


Give this a try when you get a chance and let us know how it goes.

Friday, August 21, 2015

Use kinetic models to obtain conservative estimates of TMR (time to maximum rate)

Readers with an interest in process safety (isn't that everyone?) should be aware of some important limitations in the traditional method for obtaining TMR, the time to maximum rate, as referenced here, for example.

Wilfried Hoffmann, one of our principal consultants supporting users and an experienced former specialist in process safety at Pfizer, highlighted in his December 2014 DynoChem webinar how:

  1. the traditional approach to TMR using MTSR (maximum temperature reached as a result of adiabatic temperature rise of the desired reaction, after a cooling failure) ignores the kinetics of the desired reaction; that makes it simple, but potentially less accurate; this is understandable as when the method was developed, kinetics were less readily obtained
  2. the traditional method neglects the time to MTSR in calculating TMR and time to explosion
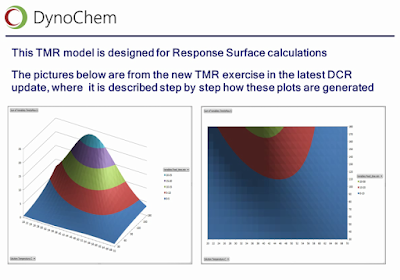
  3. the modern method uses kinetics to get the true TMR
  4. there are two extremes where the difference between traditional and modern methods is significant:
    • with a slow reaction, perhaps taking place at low temperature, it may take a long time to reach MTSR; in this case, traditional TMR < true TMR and the traditional method may be used safely; it overestimates risk
    • in situations where on the way to MTSR, there is a heat flow contribution from the undesired reaction, the adiabatic temperature rise will then be higher than MTSR and the true TMR will be shorter than the estimate using the traditional method.

You can watch a preview of Wilfried's discussion on YouTube.  You can also read more in his book chapter here.

Needless to say, we recommend that you use kinetic information to calculate TMR, so that you can make stronger safety statements.  If you have access to DynoChem and our online library, follow this link to find the main tools, step by step training and a nice customer case study by Siegfried.

Slide from Wilfried Hoffmann's webinar, illustrating response surfaces of true TMR, obtained from kinetic models of the desired and undesired reactions.

Wednesday, July 29, 2015

Kinetics from HPLC data - DynoChem guidance documents

HPLC area and area percent are some of the most commonly used data for reaction and impurity profiling and monitoring.  Customers collect these data all the time, whether working in the lab or the plant, in early or late phase development.  HPLC data are routinely used in regulatory filings and to ensure quality and compliance.

The good news for DynoChem users is that reaction kinetics may also be obtained from these data, when certain conditions are met.  Yes, there is some fine print, but not too much.  Armed with kinetics, you can run fewer, better experiments and save weeks or months of experiments and speculation.  (You might enjoy our playlist of short humorous videos on this very topic.)

In this and several other application areas, our team have recently written new 'Guidance Documents'. These follow a standard format and are short and to the point.  They provide a helicopter view and a roadmap for applying DynoChem in a specific application area.  Naturally the guidance document for reaction kinetics puts a lot of emphasis on HPLC data.  You can get the full story by following this link.

Contents page of the Reaction Modeling Guidance Document: click for step by step instructions.

Wednesday, July 8, 2015

Generate cocrystal ternary phase diagrams to support process design

We love to provide solutions that save customers time.  A good example arises in process and experimental design aimed at formation of cocrystals.

DynoChem already includes tools to support solvent selection for crystallization and these can indicate the effects of solvent choice on API ("A"), coformer ("B") and cocrystal ("AB") solubility, based on a handful of measurements in a few solvents.  We also provide templates for solution-mediated conversion between forms and drug product salt disproportionation in the presence of excipients.

For cocrystals, once solubilities are known, either by measurement or prediction, a DynoChem dynamic model can simulate in a few seconds the time-dependent equilibration of a large set of potential experiments, reducing the need for painstaking and slow lab experimentation.

Figure 1: Process scheme for simulating cocrystallization process; more solid phases may be included as needed

With this model, users can simulate the relative and total amounts of each of the (e.g. three) solid phases that may result from different starting conditions.  Those results can be plotted and summarized on a ternary phase diagram that summarizes the 'regions' of initial composition that lead selectively to formation of the desired phase.

Figure 2: Ternary phase diagram for an example cocrystal system, with a 1:1 cocrystal AB.

Contact support@scale-up.com if you'd like to discuss using these tools, or related applications to enantiomers and other systems.  Thanks to Dr Andrew Bird for providing the above illustrations.  

Friday, January 23, 2015

DynoChem Training Videos - Train Yourself Anytime

We just published today the first 13 in a series of short videos based on our instructor-led training.

You can use these to learn or polish up on your DynoChem skills when you have DC installed and access to the DCR website:


We hope you find these valuable in your work.

ShareThis small