Showing posts with label CQA. Show all posts

Wednesday, January 27, 2021

Dynochem biologics model library released

Many thanks to customers who engaged with Scale-up Systems as we "built, broke and bettered" our biologics model library in the run-up to release late last year.

More than one hundred biopharmaceutical companies in the Scale-up Suite global user community can now access the tools for immediate use here (https://dcresources.scale-up.com/?q=bio).  An overview of the biologics library is available here.

We expect each tool to grow and be refined by the repeated use that is typical of customer activity and we look forward to supporting more users in taking up the tools in their daily work.

Much like the small molecule opportunity, mechanistic modeling has great potential to accelerate the development of large molecules by shortening development time, making best use of experiments and anticipating manufacturing challenges.  Ours is the first fit-for-purpose and comprehensive mechanistic model library to be built and released in this space, another first of which we are very proud.

Using the Dynochem biologics library delivers daily benefits in development and scale-up while creating digital twins to support your digitalization strategy

Training opportunities using the new tools will be available at regular intervals this year.  Let us know if you'd like a dedicated session for your company or site.

Feel free to share this post with anyone you think may benefit.

Tuesday, December 1, 2020

Digital Tech Transfer using the Dynochem Vessel Database

The pharma industry practice of 'process fit', which allows the manufacture of most products by re-using existing physical assets, raises the perennial question of whether a given process running well at Lab A or Site B can also be run well at Site C.  Anyone who cooks or bakes even occasionally in their own kitchen will know that equipment dimensions and operating conditions affect product quality (and cycle time) and the same is true at manufacturing scale.

This problem used to be handled with a 'boots on the ground' approach, where extensive air travel and time on site allowed detailed oversight, some costly experimentation and tweaks locally before manufacturing.  With a large portion of manufacturing now contracted out to CDMOs, tech transfer remains challenging unless you have the right tools.

Working with over 100 companies engaged in the development and manufacture of pharmaceuticals, we get an up-close look at the issues, challenges and opportunities around tech transfer.  Probably the single biggest factor that makes our tools indispensable to accelerate this work is the Dynochem Vessel Database.

Users like to achieve 'equivalence' between equipment performance at the transferring and receiving sites.  Equivalence may sound simple but the different scaling laws that apply to mixing, heat transfer, solids suspension and mass transfer make this complex; and that's before even considering meso-mixing and micromixing.  Apparently inconsequential differences that are easy to miss, such as materials of construction, heat transfer fluids, impeller types, sizes and positions and even feed locations can have a large impact on performance at the receiving site.  

The likelihood of Right First Time tech transfer increases dramatically with a sufficiently detailed Vessel Database that accurately stores the configuration of site equipment.  Link that with the recipe of the target process, our equipment calculators and peer-reviewed physical properties from our Materials System and you can perform Digital Tech Transfer quickly and accurately without leaving your desk.

If you haven't already created the Vessel Database for your site or wider organization, you can start here from our template.  It's an ideal project for a young engineer and once done correctly, saves time for everyone on the team.

Selection of 'impeller' types in the Dynochem Vessel Database; users may also add custom impellers and internals

Friday, June 7, 2019

Part 4 of 6: Where will the models come from?

If mechanistic modeling is to become a focal point in the project lifecycle, you have to address the question of where the models will come from.  In this context, by 'model' we mean i) the set of equations to be solved, ii) in executable form, with iii) initial values, iv) fitted parameter values where needed and v) experimental data to assess model accuracy.

Q: Who can create these models and when does it make sense for them to do so?
A: For tangible benefits the creators and users should be the same practitioners / project teams that own and run the development projects.  Not some specialists in an ivory tower that are focused only on modeling.  Model development should occur before and during experimentation.  Modeling should not be a 'post-processing' activity that occurs too late to add value or when the time window for data collection has passed.

In Dynochem 5 and Reaction Lab, we have streamlined the process in i) to v) so that this vision is achievable.  We include further notes on the individual steps below.

Steps i) to v) can be accomplished in a snap for chemical reactions using Reaction Lab.  The resulting model can be leveraged over and over during the project lifecycle.
Item (i) may be clear and simple for certain common unit operations like heating/ cooling and perhaps filtration; for many other operations, identifying which equations to solve may be iterative and challenging.  For models of fairly low complexity, like distillation, while the equation set may be obvious it is unwieldy to write down for multi-component systems including the energy balance.  For models of chemical reactions, the set of elementary reactions will not become clear until the full cycle i)-v) has been repeated more than once by knowledgable process chemists.

Unlike some other tools, we do not force users to populate 'matrices' just to define reactions and reaction orders (!)

Item ii) is an obstacle for practitioners who only have access to spreadsheets, or specialized computing/coding environments.  These force the user to develop or select a specific solution method and run risks of significant numerical integration inaccuracies.  Even then, simulations will lack interactivity and parameter estimations will require scripting or complex code.  Some 'high-end' engineering software tools present similar challenges, lacking comprehensive model libraries and forcing users to write custom models, delve into solution algorithms and confront challenges such as 'convergence' that feel highly tangential to project goals.

Item iii) should be easy for practitioners and in practice it can be so, if the software supports flexible units conversion (in and out of SI units) and contains supporting tools to provide initial estimates of physical properties and equipment characteristics.

Item iv) requires the model to be run many times and compared with experimental results.  Specialized algorithms are needed to minimize the gap between model predictions and experimental data.  When multiple parameters must be fitted to multiple responses in multiple experiments, this gets close to impossible in a spreadsheet model and general-purpose mathematical software environments.

Item v) is mainly the province of the experimenter and once each experiment has been completed, requires an easy mechanism for aggregating the data, with flexible units handling (including HPLC Area, Area%) being a major help.

And so to answer the question in the title of this post: You guessed it!  We expect the majority of chemical reaction and unit operation models in Pharma to continue to be developed using our tools in preference to home-made or overly complex environments.  As the volume of modeling activity grows with Industry 4.0 and related developments, we already see this trend becoming more pronounced, with many practitioners needing to use the same model over a project lifecycle, requiring speed and ease of use as well as accuracy and rigour.

Wednesday, May 1, 2019

Post 2 of 6: A brief history

The Wall Street Journal ran an article in September 2003, entitled "New Prescription For Drug Makers: Update the Plants", comparing and contrasting pharma manufacturing techniques with other industries.  The subtitle ran, perhaps unfairly, "After Years of Neglect, Industry Focuses On Manufacturing; FDA Acts as a Catalyst".

Our DynoChem software entered the industry a few years prior, the prototype having been developed as a dynamic simulator within Zeneca, so that users could "create a dynamic model without having to write differential equations".  We first proved that the software could be used to solve process development and manufacturing problems (e.g. with hydrogenations, exothermic additions), then rewrote the source code and began to add features that made modeling by non-specialists an everyday reality.

There have been many pharma industry leaders who have recognized the potential for modeling to help modernize development and manufacturing.  One example is Dr Paul McKenzie and his leadership team at Bristol-Myers Squibb (BMS) at the time, who cited the Wall Street Journal piece in an invited AIChEJ Perspectives article and also in presentations like this one at the Council for Chemical Research (CCR) in December 2005 - you can get the full slide deck here.

Cover slide from presentation by Paul McKenzie of BMS at CCR Workshop on Process Analytical Technology (PAT), December 13, 2005, Rockville, MD
Today, while the landscape for data storage, sharing and visualization has moved ahead significantly, with the emergence of ELN, cloud and mobile, the chemical and engineering fundamentals of defining and executing a good manufacturing process remain the same:

Some capabilities required to develop robust and scalable processes, from the 2005 CCR presentation
Our Scale-up Suite extends these capabilities to more than 100 pharma development and manufacturing organizations worldwide, including 15 of the top 15 pharmaceutical companies.  This broad and growing base of users, armed with clean and modern user interfaces, calculation power and speed in Reaction Lab and Dynochem 5, provides a firm foundation for the next wave of industry transformation.

We're always delighted to hear what users think.  Here are some recent quotes you may not have seen yet:

  • "If you can book a flight on-line, you can use Dynochem utilities" [we like this especially because we hear that using some other tools is like learning to fly a plane]
  • "Our chemists are thoroughly enjoying the capabilities of Reaction Lab software and are quite thrilled with the tool".

In the next post, we will look at the increasingly central role of mechanistic modeling in process development.

Tuesday, February 27, 2018

A PSD trend that is not widely reported - thanks, Orel

While supporting customers who apply DynoChem for crystallization modeling, we have seen several cases where some of the familiar quantiles of the PSD (D10, D50, D90) reduce with time during at least the initial part of the crystallization process.

On reflection one should not be that surprised: these are statistics rather than the sizes of any individual particles.  In fact, all particles may be getting larger but the weighting of the PSD shifts towards smaller sizes (where particles are more numerous, even without nucleation) and in certain cases, this causes D90, D50 and maybe even D10 to reduce during growth.

Last week we had an excellent Guest Webinar from Orel Mizrahi of Teva and Ariel University, who characterized a system with this behaviour, with modeling work summarised in the screenshot below.

D10, D50 and D90 trends in a seeded cooling crystallization: measured data (symbols) and model predictions (curves).
There was a good discussion of these results during Orel's webinar and we decided to make a short animation of a similar system using results from the DynoChem Crystallization Toolbox to help illustrate the effect.
Cumulative PSD from the DynoChem Crystallization toolbox, showing the evolution of PSD shape during growth from a wide seed PSD.  The movement of quantiles D10, D50 and D90 is shown in the lines dropped to the size axis of the curve.
In this illustration, the reduction in  D50 can be seen briefly and the reduction in D90 continues through most of the process.  From the changing shape of the curve,  with most of the movement on the left hand side, most of the mass is deposited on the (much more numerous) smaller particles.

We see this trend even in growth-dominated systems, when the seed PSD is wide.

Wednesday, January 24, 2018

Run typical crystallization experimental design in silico using DynoChem

Faced with challenging timelines for crystallization process development, practitioners typically find themselves running a DOE (statistical design of experiments) and measuring end-point results to see what factors most affect the outcome (often PSD, D10, D50, D90, span).  Thermodynamic, scale-independent effects (like solubility) may be muddled with scale-dependent kinetic effects (like seed temperature and cooling rate or time) in these studies, making results harder to generalize and scale.

First-principles models of crystallization may never be quantitatively perfect - the phenomena are complex and measurement data are limited - but even a semi-quantitative first-principles kinetic model can inform and guide experimentation in a way that DOE or trial and error experimentation can not, leading to a reduction in overall effort and a gain in process understanding, as long as the model is easy to build.

Scale-up predictions for crystallization are often based on maintaining similar agitation and power per unit mass (or volume) is a typical check, even if the geometry on scale is very different to the lab.  A first principles approach considers additional factors such as whether the solids are fully suspended or over-agitated, how well the heat transfer surface can remove heat and the mixing time associated with the incoming antisolvent feed.

The DynoChem crystallization library and the associated online training exercises and utilities show how to integrate all of these factors by designing focused experiments and making quick calculations  to obtain separately thermodynamic, kinetic and vessel performance data before integrating these to both optimize and scale process performance.

Users can easily perform an automated in-silico version of the typical lab DOE in minutes, with 'virtual experiments' reflecting performance of the scaled-up process.  Even if the results are not fully quantitative, users learn about the sensitivities and robustness of their process as well as its scale-dependence.  This heightened awareness alone may be sufficient to resolve problems that arise later in development and scale-up, in a calm and rational manner.  Some sample results of a virtual DOE are given below by way of example.

Heat-map of in-silico DOE at plant scale agitation conditions, showing the effects of four typical factors on D50
The largest D50 is obtained in this case with the highest seeding temperature,  lowest seed loading and longest addition (phase 1) time. Cooling time (phase 2) has a weak effect over the range considered.
Click here to learn how to apply these tools.

Thursday, December 21, 2017

Congratulations to Dr Jake Albrecht of BMS: Winner of AIChE QbD for Drug Substance Award, 2017

At AIChE Annual Meetings, Monday night is Awards night for the Pharma community, represented by PD2M.  This year in Minneapolis the award for Excellence in QbD for Drug Substance process development and scale-up went to Dr Jake Albrecht of Bristol-Myers Squibb.  Congratulations, Jake!


Winners are selected using a blinded judging panel selected by the Awards Chair, currently Bob Yule of GSK.  Awards criteria are:
  • Requires contributions to the state of the art in the public domain (e.g. presentations, articles, publications, best practices)
  • Winner may be in Industry, Academia, Regulatory or other relevant working environment
  • Winner may be from any nation, working at any location
  • There are no age or experience limits
  • Preference is given to work that features chemical engineering
Jake was nominated by colleagues for:
  • his innovative application of modeling methodologies and statistics to enable quality by design process development
  • including one of the most downloaded papers in Computers and Chemical Engineering (2012-2013), “Estimating reaction model parameter uncertainty with Markov Chain Monte Carlo
  • his leadership and exemplary efforts to promote increasing adoption of modeling and statistical approaches by scientists within BMS and without
  • his leadership in AIChE/PD2M through presentations, chairing meeting sessions, leading annual meeting programming and serving on the PD2M Steering Team
Scale-up Systems was delighted to be involved at the AIChE Annual Meeting this year in our continued sponsorship of this prize.  Some photos and video from the night made it onto our facebook page and more should appear soon on the PD2M website.

Jake is also a DynoChem power user and delivered a guest webinar in 2013 on connecting DynoChem to other programs, such as MatLab.

Wednesday, October 25, 2017

Simulating PFRs for flow chemistry under transient upset conditions

Readers of this blog will be aware of our RTD utility that helps characterize continuous manufacturing (CM) equipment trains and also simulate the impact of process disturbances, in the absence of chemical reactions.  Pharma CM processes typically have several layers of controls to help ensure that off-spec material is diverted when necessary and as far as possible that disturbances are minimized and detected early. 

For regulatory filings or other purposes, from time to time it may be necessary to simulate transient/ upset conditions in chemically reacting systems (e.g. making drug substance intermediates or final API) to understand the additional chemical effects and to define boundaries for acceptable levels of input variation.  We have been exploring such cases and the most effective way to model them in DynoChem.  Some interesting DC Simulator plots are shown below to illustrate when and for how long such upsets might affect the exit CQA (blue) and impurity level (green) from an example PFR (average residence time 30 minutes) with a ‘typical’ side-reaction. 

Simulation of plug flow reactor with significant and frequent fluctuations in four input variables. These unusually large variations if left unchecked would lead  in this example to a breach of the CQA limit (high impurity) twice during a 3 hour operating period. 

Simulation of plug flow reactor with a feed pump failure at 90 minutes, lasting for 30 minutes.  In addition to reducing  product output, depending on which feed pump fails, this may lead to a temporary increase in impurity level until the feed is restored.

Wednesday, August 23, 2017

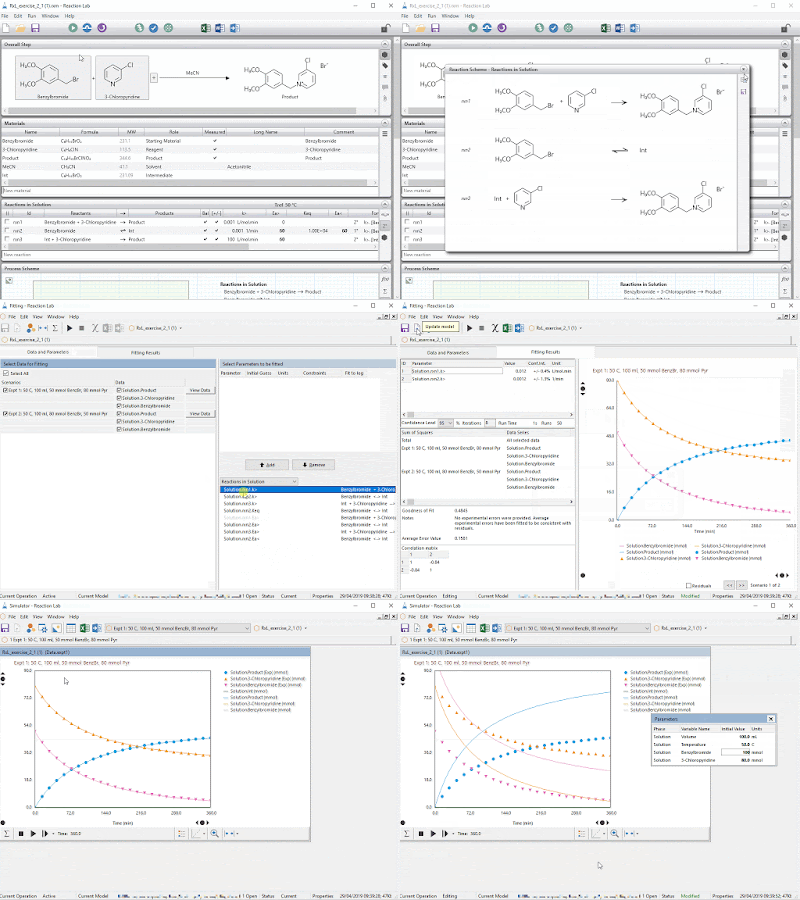
Finding the rate law / reaction mechanism: exercise shows the way

We highly recommend that chemists and engineers involved in kinetic modeling take our dedicated exercise that focuses on determining the correct rate law.

In DynoChem's Fitting window, it is easy to quickly try different parameter fitting options and especially select different groups of parameter to fit. When confronted with new data, models can be adapted and further developed, in this case to better capture the reaction mechanism.

This exercise takes you through that workflow using  the Menschutkin reaction of 3,4-dimethoxybenzyl bromide and 3-chloro-pyridine:


A handful of well-controlled experiments followed by sampling together with use of the DynoChem Fitting window allows the single-line reaction to be broken out into a series of elementary steps that better represent the chemistry.  On this foundation, users build a model suitable for reaction optimization and scale-up, saving unnecessary experiments and providing a sound basis for process decisions.

Go on - take 20 minutes to give it a try.  Then share the link with your colleagues so they can start saving time on their development projects.

Saturday, July 15, 2017

How to check the mole balance in your HPLC data and build better kinetic models

We've posted before on the topic of fitting chemical kinetics to HPLC data. Some good experiment planning and design can make this much faster, easier and more informative than a retrospective 'hope for the best' attempt to fit kinetics to experiments coming out of an empirical DOE.

Once the data have been collected from one or two experiments, it's time to check the mole balance. That means checking that your mental model of the chemistry taking place (e.g. A>B>C) and to which your DynoChem model will rigorously adhere, is consistent with the data you have collected. There's a nice exercise in DC Resources to take you through this step by step, using chemistry inspired by a reaction on which Mark Hughes and colleagues of GSK have published and presented.


The exercise starts with HPLC area (not area percent) and after correcting for relative responses leads directly to a new insight into the reaction, even before the first simulation has been run.  When the modeling and experiments are done alongside each other and at the same time, such early insight impacts subsequent experiments and makes them more valuable while reducing their number.

We encourage you to take the exercise to learn this important skill and how to build better, more rigorous and more reliable kinetic models.

Sunday, January 22, 2017

Update 100 to feature enhanced DynoChem vessel mixing and heat transfer utilities

Later this month we will make our 100th round of updates to tools and content in the DynoChem Resources website, so that these are available immediately to all of our users worldwide.  It's appropriate that this 'century' of enhancements is marked by a major release of improved vessel mixing and heat transfer utilities, a cornerstone of scale-up and tech transfer for pharmaceutical companies.

We are grateful to the many users and companies who have contributed requests and ideas for these tools and we have delivered many of these in the 2017 release of the utilities. Ten of the new features are listed below, with a 'shout out' to some customers and great collaborators who led, requested or helped:

Power per unit mass (W/kg) design space for lab reactor;
to produce these results, hundreds of operating conditions are simulated within seconds.
 
Power per unit mass (W/kg) design space for plant reactor;
to produce these results, hundreds of operating conditions are simulated within seconds.
Design space may be generated with one click on Results tab; 
hundreds of operating conditions are simulated within seconds.
  1. A new Design space feature has been included in several utilities that calculates process results over a user-defined range of impeller speed and liquid volume.  Hundreds of operating conditions are simulated within seconds.  When applied to both Vessel 1 and Vessel 2, this allows identification of a range of operating conditions in each vessel that lead to similar calculated mixing parameters.  Design space buttons are available on the Results worksheets and produce tables and response surface plots. [with thanks to Andrew Derrick, Pfizer] 
  2. We have enhanced Vessel 1 and Vessel 2 Reports, including the user’s name, the date and the version number of the utility.  Reports now also contain individual impeller power numbers, UA intercept and UA(v) where applicable. [with thanks to Roel Hoefnagels, J&J]
  3. We have extended our standard list of impellers, including the two-bladed flat paddle and a marine propeller [with thanks to Ramakanth Chitguppa, Dr Reddys]
  4. Users can now name, include and define multiple custom/user-defined impellers on the Impeller properties tab; vessel database custodians can define a custom impeller list for use across an organization. [with thanks to Ben Cohen and colleagues, BMS]
  5. Users can easily import their organization’s vessel database (including custom impellers) from a file on the network, Intranet or web site.  This means that all users can apply the latest utilities from DynoChem Resources and there is no need for power users / custodians to make separate copies of the utilities and share them for internal use. [with thanks to Dan Caspi, Abbvie]
    One click imports the organization's vessel database and custom impellers
  6. Unbaffled Power number estimates have been enhanced and made a function of Reynolds number.
  7. We have added calculation of an estimate of the maximum power per unit mass generated by impellers in a vessel, based on calculations related to the trailing vortex produced by the blades. [thanks to Ben Cohen, BMS, Andrew Derrick, Pfizer and Richard Grenville, formerly DuPont]
  8. We have added calculation of torque per unit volume, a parameter sometimes used in systems with higher viscosity and by agitator vendors.
  9. We have added the Grenville, Mak and Brown (GMB) correlation as an alternative to Zwietering for solids suspension with axial and mixed flow impellers [with thanks to Aaron Sarafinas, Dow].
    The Grenville Mak and Brown correlation is a new alternative to Zwietering
  10.  Some worksheets are partially protected to prevent unintended edits by users.  There is no password and protection can be removed using Review>Unprotect sheet.

Thursday, December 8, 2016

Congratulations to Dr Marty Johnson of Lilly

Congratulations to Dr Marty Johnson of Lilly, Indianapolis on being this year's winner of AIChE's prize for Outstanding Contribution to Quality by Design for Drug Substance process development and manufacturing.


Marty's nomination was based on a very strong record of innovation and publication related to continuous manufacturing (CM) of active pharmaceutical ingredients and their intermediates, including:
  • being a driving force behind the pharmaceutical industry’s adoption of continuous processing
  • advocating how continuous processing can transform the quality, safety and cost profile of the pharmaceutical manufacturing sector
  • design of equipment platforms that are scalable and able to handle a range of process chemistries and conditions, and
  • more than 25 external publications including innovative ways to run chemistry, equipment characterization, reactor development, process modelling.
Scale-up Systems was delighted to be involved at the AIChE Annual Meeting this year in our continued sponsorship of this prize.  Marty stopped off in San Francisco en route to Asia to collect his award.  Photographs of the awards session will be available here soon. 

Interested in knowing more about CM?  Attend the CM2017 Workshop in Ireland in February 2017.

Friday, September 30, 2016

The 'Doers' in CM meet in Ireland in February 2017

You'll know from previous posts that FDA-AIChE organized a first successful workshop on adoption of CM in Besthesda in February 2016.  That is to be followed just under one year later by a second workshop in Ireland on 22-23 February, 2017.


Like the first workshop, this one will bring together the 'doers' in adopting CM; that is:
  • site leaders and senior managers from pharma manufacturing sites; 
  • leading scientists and engineers driving adoption from HQ and locally; 
  • regulators including reviewers and inspectors and members of emerging technology teams; 
  • and leading investigators from collaborative research centers worldwide.
We will spend two days together hearing the latest updates and progress from industry practitioners, regulators and principal investigators, and in breakout sessions and a tour of a  live operating CM facility for drug substance.  All talks and discussions will address three core themes:
  • Regulatory considerations: expectations for filing and process validation across the product lifecycle (especially how CM differs from batch)   
  • Control strategy, including application of PAT 
  • (Opportunities for) Industry / academic collaboration for shared learning and to address open questions.
Those interested in progressing CM filings, the future of pharmaceutical manufacturing and looking to have an influence or make a contribution in this field will find this workshop valuable and informative.  We look forward to seeing you there.

Online registration and further details of the program will be available shortly.  If you'd like more details in the meantime, contact contact co chairs Mark Barrett (APC) and Joe Hannon (Scale-up Systems).

Tuesday, August 30, 2016

Funnel plot helps define control strategy for continuous process

At the FDA-AIChE Continuous Manufacturing (CM) workshop in Bethesda this year, I enjoyed the talk by Ahmad Almaya of Lilly on drug product CM, especially the part introducing 'funnel plots'.

These are a tool to determine for a given CM system and line flow rate the range of disturbance sizes and durations that can be handled before exiting product would drift out of specification. Disturbances could be caused by factors such as equipment failure or changeover in raw material properties; higher amplitudes are harder to deal with.  Disturbance duration reflects how long it takes for such a problem to be detected and the control system response to be put in place; a quick response is obviously best.

In late June, we held a webinar to introduce our latest tool for CM, which calculates the residence time distributions of a sequence of operations (e.g. telescoped reactions and/or workup and isolation for Drug Substance; a sequence of Drug Product operations; or an end to end process).  We simulated the response of the product stream to a series of disturbances and then generated the funnel plot shared below.
Funnel plot for a CM process:
Disturbance amplitude (here labeled 'deviation') on the y-axis and disturbance duration (min) on the x-axis.  Any disturbance in the 'green zone' in this case keeps product in spec while the red zone results in OOS material.
We think this is a very useful representation for use in filings and tech transfers and it's also easy to generate.

Tuesday, June 21, 2016

Links to some good recent Continuous Manufacturing (CM) talks

Unless you've recently returned to earth from a distant planet, you'll be aware of the momentum behind adoption of continuous manufacturing (CM) in pharma and its close relative, Flow Chemistry.  Our team have been active in this area for more than two decades and if you're part of our user community you will know about the relevant equipment, properties and kinetic modeling tools we provide.

Simulation of the response of a CM system to disturbance, using CM synthesis of Ibuprofen as an example.
We've been attending some of the higher profile CM events and also developing additional tools to help manage specific risks.  Here are some links to talks we saw at two events this year that we hope you find useful:

From the ISPE one-day meeting, CONTINUOUS MANUFACTURING – THE FUTURE OF PHARMACEUTICALS?, held in Cork, Ireland in late May:


From the FDA-AIChE Workshop on Adoption of Continuous Manufacturing: held in Bethesda, Maryland at the end of February:


Monday, May 9, 2016

New DynoChem cooling and antisolvent crystallization toolbox released

We were delighted to release in April our new crystallization process design toolbox, having spent much of 2015 working with customers to better define requirements and piloting the toolbox as it developed in several live sessions.

Inspired by the user interface of our successful solvent swap model, the Main Inputs tab serves as a dashboard for designing and visualizing your crystallization process.

You can get a good intro to the toolbox from the preview webinar we recorded in January 2016.  In short, we combined several of our popular crystallization utilities, enhanced them and then automated the building of a crystallization kinetic model in the background.  That model is ready to use for parameter fitting and detailed process predictions if you have suitable experimental data.

As you might expect, you can generate a solubility curve within seconds of pasting your data.  You can also make quick estimates of operating profiles (cooling and/or addition) for controlled crystallization.  And you can estimate the final PSD from the seed PSD and mass.  That's all within a few minutes and before using the kinetic model.

The toolbox supports both design of experiments (helping make each lab run more valuable) and design of your crystallization process, especially in relation to scale-up or scale-down.  There's a dedicated training exercise that walks you through application to a new project.

We'd be delighted to hear your feedback in due course.

Wednesday, May 4, 2016

Continuous Manufacturing: A tide in the affairs of men

A lot of the good 'flow' puns and quotations are already well used by us and others.  However, the words of Brutus in Shakespeare's Julius Caesar do seem quite apt for the current momentum behind continuous manufacturing / aka 'flow chemistry'.

Scale-up Systems was delighted to attend Flow Chemistry III in Cambridge, UK, March 14-16, where an international group of practitioners from academia, industry and continuous reactor vendors assembled to share state-of-the-art work in this area.

Numerous university researchers, including Prof. Oliver Kappe of Karl-Franzens University, talked about how this technology is allowing them to work in conditions not possible with traditional round bottom flasks and to approach new chemistries in this way.  While industrial speakers mainly concentrated on the benefits and practicalities of operating continuously.  These ranged from Jesus Alcazar of Jannsen who presented their roll-out of “Flow Chemistry as a tool for Drug Discovery” through to Malcolm Berry who’s plenary detailed GSK’s journey in “Industrialisation of API Continuous Processing, from Lab to Factory.  What have we learnt along the way?” 

A strong take home for Scale-up Systems was an oft-repeated message that DynoChem and reaction kinetics are key tools for implementation of Continuous Manufacturing of APIs.   Prof Frans Muller of Leeds University made a presentation that covered in detail how kinetic motifs can be used to explore the Design Space with limited experimental data and this message was echoed by Malcolm Berry who noted that a wealth of process knowledge was obtained with a kinetic model that would not have been possible via a DoE approach.

You can find relevant tools in our online library with this link.  Watch out for a new utility coming shortly for modeling a sequence of unit operations based on residence time distribution models.


Wednesday, February 24, 2016

Mitigating the Risk of Coprecipitation of Pinacol during Isolation from Telescoped Miyaura Borylation and Suzuki Couplings ...

We thought we would highlight this recent reference as one that is worthy of your attention.

It's a nice combination of different types of process model and experimental data to understand an unexpected problem and find operating conditions to ensure high purity product.

The elegant approach spans multiple unit operations, as shown below.


Monday, November 23, 2015

AIChE 2015; QbD, Awards, Reception; honoured to be made a Fellow

Readers of this blog (and members of the DynoChem community in general) will be aware that the AIChE Annual Meeting is an excellent place to learn about the current practicalities of implementing QbD.

The 2015 Annual meeting took place in Salt Lake City earlier this month and three of our team attended, Peter, Marion and myself (Joe).  We attended the pharma sessions mostly, plus a few process development, green chemistry and mixing sessions.  We were delighted to see so many customers presenting their DynoChem work and you can download a list of papers that referenced DynoChem here (Microsoft OneDrive) or here (Dropbox).  We also presented on some lab reactor characterisation work carried out with Pfizer and this will be presented as a DynoChem webinar in 2016 and the slides will be made available in DynoChem Resources.

We participated in the QbD Awards presentation, where the drug substance prize sponsored by our company (Scale-up Systems) went to Dr Dan Hallow of J&J (formerly BMS).

And we held a reception/party for our customers, which we run every few years, featuring news and previews of forthcoming tools and the DynoChem Jeopardy game, in which the categories this year were Chemistry, Chemical Engineering, Ireland and DynoChem.  A team assembled from Hovione (Portugal), Dow (Freeport, TX) and Eastman (Kingsport, TN) won the prize.  For more pictures, see our Facebook page.

Winners of DynoChem Jeopardy at AIChE 2015
Finally, I had the honour this year of being made a Fellow of AIChE, a distinction that I will wear with pride and also leverage to spread the word about the power of excellent chemical engineering in today's world.


Thursday, August 20, 2015

Continuous improvement, with enhanced tools and guidance for PFR, CSTR and axial dispersion models

Readers will doubtless be aware of the momentum behind the move to continuous manufacturing of pharmaceuticals and the "Need for enhanced process understanding ...Availability of mechanistic models for all processing steps".  We frequently support customers either exploring or making the transition from batch to continuous and there are many case studies available showing how to use DynoChem in this context.

In the August update of our online library, we added new guidance documents on how to apply the platform tools in this area.  Separate documents address PFR, CSTR and PFRs with axial dispersion. We also enhanced each of the models and the training exercises that step you through an application.

For those who are interested in connecting models together in a flowsheet simulation, we set up a few examples illustrating how to do this and these are available to certified and power users on request from our support team.
Substrate concentration versus residence time for second order reaction with 5% excess.  Comparison of ideal PFR with tanks-in-series models representing different degrees of backmixing / axial dispersion.
We'd be glad to receive your feedback in due course on all of the above.

ShareThis small