On a personal level, we shared a lot of laughs and discussions at meetings and conferences of the North American Mixing Forum.
Professionally, Ed was the lead author of the Handbook of Industrial Mixing and before that had an outstanding chemical engineering career with Merck. Ed's observations of mixing effects on homogeneous reactions spawned a whole new field of research and ultimately led to understanding of phenomena such as micromixing and mesomixing.
Ed's 1971 paper following his PhD thesis spawned a whole new field of chemical engineering research
Scale-up Systems was delighted to host Ed in Dublin for a few days in August 2002, when he shared his experiences of Pharmaceutical chemical development and scale-up and delivered extensive notes that we used to strengthen our model library and knowledge base for customers.
Some notes from Ed's consulting visit to Scale-up Systems in Dublin, 2002
Thanks to all the users who worked with us on crystallization projects, especially during 2015, and received training in 2015 and 2016 on the new cooling and antisolvent crystallization toolbox.
For our part, we've been making some of the requested enhancements and the latest version includes additional options for automatically generating cooling and/or addition rate profiles to reach specific process goals. If you haven't taken a look for a few months, watch this video preview of the quick design sheets and if that whets your appetite, download the toolbox and take the training exercise.
This two-minute video preview shows rapid generation of a solubility curve and quick calculation of potential cooling and/or addition rate profiles and their impact on the rate of crystallization. [Main steps shown with captions - musical accompaniment by Beethoven :)]
We were delighted to release in April our new crystallization process design toolbox, having spent much of 2015 working with customers to better define requirements and piloting the toolbox as it developed in several live sessions.
Inspired by the user interface of our successful solvent swap model, the Main Inputs tab serves as a dashboard for designing and visualizing your crystallization process.
You can get a good intro to the toolbox from the preview webinar we recorded in January 2016. In short, we combined several of our popular crystallization utilities, enhanced them and then automated the building of a crystallization kinetic model in the background. That model is ready to use for parameter fitting and detailed process predictions if you have suitable experimental data.
As you might expect, you can generate a solubility curve within seconds of pasting your data. You can also make quick estimates of operating profiles (cooling and/or addition) for controlled crystallization. And you can estimate the final PSD from the seed PSD and mass. That's all within a few minutes and before using the kinetic model.
The toolbox supports both design of experiments (helping make each lab run more valuable) and design of your crystallization process, especially in relation to scale-up or scale-down. There's a dedicated training exercise that walks you through application to a new project.
We'd be delighted to hear your feedback in due course.
Are you managing a team that works in process development and scale-up? Or working at the coalface applying our tools on a regular basis? Or perhaps you're a former DynoChem user whose modeling exploits have helped lead to rapid promotion :) and it's been a while since you last visited us?
Either way, you should find the following links interesting and useful as you start the new year of 2016.
For general advice on topics in process development and scale-up, use the 'advice' search string in DynoChem Resources, or click this link: https://dcresources.scale-up.com/?q=advice
One document that appears in this list has some new additions including a list of typical values for process parameters and a list of recommended text books for your department library.
The solid-liquid separation guidance has been updated recently to help define how to set up a lab filtration rig, thanks to publications by customers such as BMS and Amgen:
If you're looking for more specific help or background information when applying one of our tools, search instead for 'help' or click https://dcresources.scale-up.com/?q=help.
Of course you can share all of these links with your team and colleagues by email and otherwise.
And we'd love to get both your and their feedback in due course so that we can improve our tools for the benefit the whole process development and scale-up community.
When planning to select or use a spray dryer in the lab or at larger scale, it's important to know the right operating conditions (feed rate, gas inlet temperature, pressure) to achieve potential critical quality attributes like residual moisture and gas outlet temperature. You can map your dryer's operating space easily using the DynoChem spray dryer template, reducing your dependence on trial and error to find the right process conditions.
Results can be generated for any solvent system in a few minutes. You can also fit the heat loss parameter (UA) to better characterize your dryer. And fit the gas-liquid mass transfer parameter (kLa) if your system does not reach equilibrium.
Careful measurements of fed batch process dynamics in antisolvent crystallization systems are quite few and far between. A useful paper by the UCD Crystallization group from 2007 showed effects of agitator speed and antisolvent addition rate on the observed metastable zone width (MSZW) of benzoic acid crystallizing in ethanol/water. An FBRM probe was used to detect the onset of nucleation and MSZW was generally wider at higher addition rates. MSZW was also a little wider at higher agitation speed when the feed point was not well located (above surface near the wall of the vessel). It became narrower with higher agitation speed when the feed was more directly into the impeller suction, an effect that can be explained by the dependence of nucleation rate on agitator speed.
Higher than average supersaturation exists near the feed point and this can lead to premature nucleation, or a negative MSZW; this was observed in the UCD study at the less effective feed position. CFD calculations of the flow patterns in the lab vessel were used to explain some of the mixing effects. A paper from the UCD group in 2011, based on research in the SSPC consortium, included analysis of relevant turbulent mixing time constants estimated from CFD calculations. Other nice work in this field includes the PhD of Christian Lindenberg of ETH Zurich, the institution where Professor John Bourne completed much of his work on micromixing.
Integrated, predictive models for a system like this are useful to help practitioners to find conditions producing the right crystal number (and size) in this commonly used configuration, whether seeded or not. The scale-dependent equipment characteristics are one part and we can leverage insights from the micromixing and mesomixing research community; the DynoChem library contains tools to quantify and apply these time constants, as described in a previous post. The system-specific crystal nucleation and growth kinetics are another part and these may be fitted to solute concentration and particle number data collected during lab experimentation. Users may select from a range of rate expressions that may or may not include MSZW as a parameter; this carries some disadvantages in predictive mode as it is somewhat dependent on the conditions under which it was measured.
We have integrated these elements into detailed and fast-running models when supporting customers on projects in this area. We typically use a feed-zone model, in which the zone size depends on the quality of mixing and its composition lies between that of the feed material (often pure antisolvent) and the bulk. In this zone, if nucleation kinetics are rapid, significant nucleation can occur due to high local supersaturation. Those nuclei appear before the system as a whole is supersaturated (negative MSZW) and will mostly redissolve in the bulk if the system is not yet supersaturated as a whole. They continue to be produced throughout the feed addition process, for as long as a (local) superaturation driving force exists.
DynoChem simulation results using this integrated model for a system like the benzoic acid/ ethanol/ water system are shown below, using typical values for crystallization kinetics and driving forces based on supersaturation (not MSZW).
Figure 1:The model produces typical supersaturation curves for an unseeded system, with rising supersaturation reaching a peak that occurs at higher wt% antisolvent when the addition rate is higher. (Note that with the kinetic parameters used, the peak occurs slightly sooner at higher agitator speed.)
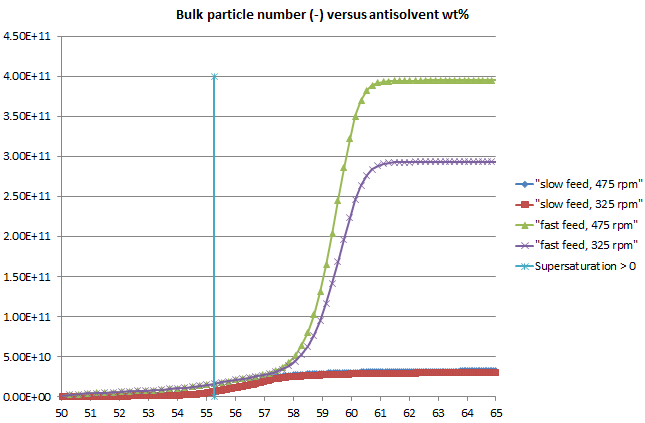
Figure 2: The number of particles formed in the system is higher when the addition rate is faster; this tallies with the higher level of supersaturation reached, with a greater driving force for nucleation. The simulation includes a direct effect of impeller speed on nucleation, leading to more particles at higher agitation speed (and fast addition).
Figure 3: In this model, the number of particles in the feed zone is tracked separately from those in the bulk; this number depends primarily on the quality of meso- and micromixing and there are more particles formed in the feed zone at lower agitator speeds. The number of particles in the feed zone is significantly higher with fast feeding. Note that particles are formed from the start of the addition but many of the 'oldest' dissolve in the bulk while those formed later have a better chance of remaining out of solution.
Figure 4: A plot of bulk particle number versus wt% antisolvent, with the scale reduced to highlight the first signs of particles in the bulk, indicates that a large number of particles may exist even when the system is undersaturated and the number of particles can be several times higher with fast feeding than with slow.
Such a particle number profile would make it more likely that a negative MSZW would be observed at higher addition rates when the FBRM (or other particle monitoring) probe may detect the larger particle number.
A potentially interesting parameter to complement MSZW is the observed induction time, which in the case of the present system reduces at higher addition rates and is often well under 1 second. This underlines the importance of rapid local mixing of the feed and induction time could be used to calculate a Damkoehler type number for the system.
The stochastic nature of both MSZW and induction time is well recognized and addressed again in a recent paper.
From a practical point of view, all of this makes it even clearer that relying on uncontrolled primary nucleation as a means to obtain a desired crystal size (or number) can be a risky approach. The same models shown here can be used to investigate the impact of seeding and to find more robust, growth-dominated conditions in a specific system.
Whatever about the quantitative and specific interpretation of the simulation results shown, the power to quickly visualize these potential impacts before experiencing them in practise is of great educational value and assists with experimental design and planning. Which reminds me of the poster I saw on the wall at a large chemical company several years ago, which read: "Don't speculate, Simulate!".
When completing the publication of our latest monthly update to the DynoChem online library of tools, we revised our CSD (crystal size distribution) to CLD (chord length distribution) conversion utility and the latest file is here.
We think this tool has educational as well as practical value, with plots of size distribution statistics and indications of how true CSD relates to what we can measure using on-line laser backscattering (an apparent CLD) or off-line laser diffraction (an apparent spherical equivalent diameter distribution).
Like all of our tools, we are keen to receive feedback by email to our support team and to make further enhancements in due course. If you like it, or think it can be improved, let us know.
Believe it or not, it is possible to find humour even in such technical material and we present below our latest CSD joke, this time from the Doctor, Doctor genre. It goes:
Patient: 'Doctor, Doctor, I don't understand the statistics of my size distribution.'
Doctor: 'Please weight a moment.'
If you like the joke, or can improve it, write a comment.
Templates that use nucleation and growth kinetics in population balance models have been available in the DynoChem online library for some time. These are a great alternative to writing all of your own code for this problem in MatLab or Excel, or investing in complex software that is in permanent beta-test mode and 'one up from Fortran'. On the other hand, our templates give you total control over the form of the rate equations, so they are ideal for research purposes. And you benefit from the features that power users love, like variable time steps, stiff solvers, flexible data handling in Excel format and so on.
DynoChem provides a general-purpose platform for operation modeling and the same environment can be used for anything from early phase reaction kinetics by process chemists through to late phase solvent swap, filtration and drying by process engineers and beyond that into drug product, dissolution and stability applications. In the pharmaceutical industry, makers of API find countless opportunities to apply these tools over and over again.
Our population balance models come in various shapes and sizes, depending on what you need to accomplish. The most rigorous of these divide the distribution into size 'classes', with linear or log-spaced intervals, and calculate the number of crystals in each class during nucleation and growth. Another variant does the reverse, with breakage and dissolution as API crystals dissolve from a tablet in the USP apparatus (or the stomach).
Knowledge of solubility and measurement of some crystallization profiles (notably solute concentration during crystallization) allow the kinetic parameters to be estimated, using the classical approaches described in Mullin's book and many other places. Armed with reasonable estimates for these parameters, valuable insights into the CSD may be obtained.
During antisolvent crystallization, composition gradients may exist near the feed point and even this can be predicted efficiently using meso- and micromixing models implemented by our team of fluid mixing experts. In general, equipment characterization completes the picture, with the ability to calculate heat transfer, solids suspension and power per unit volume using simple 'utilities'.
Here we show the beneficial impact of seed addition during a cooling crystallization: more seed (up to maximum 3.2% in this case) suppresses nucleation, eliminates a bimodal size distribution (and filtration problems plus product variability concerns) and leads to smaller sizes and a tight distribution.
Join the DynoChem training team for two days of hands-on training, using DynoChem to accelerate process development and scale-up projects.
Training will address DynoChem applications for engineers and scientists in API process development groups involved in tech transfer, troubleshooting and optimisation of API reaction, workup and isolation steps.
The agenda will cover topics such as:
Obtaining physical property values for solvents and mixtures
Phase equilibrium calculations for boiling point, identifying azeotropes and miscibility
Basics of DynoChem modelling applicable to reactions, crystallization and other operations
Training times will be from 9:00 to 4:30 each day, with 6 hours of tuition. Computers with DynoChem installed may be provided for your convenience - let us know if you will be needing one and we will confirm the cost.
Learning objectives:
By the end of the course, trainees will be able to:
• Draw and understand process schemes and use them to help think about how to model or design experiments to understand a new or existing process
• Use DynoChem utilities to estimate parameter values, compare vessels and ensure minimum agitation criteria are met in lab and plant vessels
• Model chemical reactions, including kinetics, temperature-dependence, reaction orders
• Fit chemical kinetics to typical lab data
• Optimise reactions for yield and impurity levels
• Generate response surfaces to study process robustness and determine design space for QbD submissions
• Further develop initial models to include multi-phase, scale-up and interpretation of analytical data
• Use plant data to back out equipment characteristics, especially heat transfer
• Simulate solid-liquid separation operations based on standard lab experiments
• Look up physical properties for pure components and mixtures
• Simulate solvent swap / displacement / chasing operations to optimize solvent volumes and cycle time
• Understand more about how DynoChem works internally and how it builds the model from user input
• Explore other applications and reuse learned skills to tackle other unit operations or create new templates.
The particle engineering community will soon have a new DynoChem template to work with. Probably available in the April DCR update (number 61), we have implemented the Vogel & Peukert model and users can now simulate either wet or dry milling as a means of adjusting and controlling crystal size.
The process scheme for the wet milling template looks like this:
You can fit material characteristics to data from lab trials and then simulate scale-up and changes in operating conditions:
And you can link the milling model to a crystallization model to crystallize while milling.
Well, that's what you get when you work with a modeling platform that is fit for purpose for today's pharma industry. Watch out for more new tools like this in our monthly updates.
As the final part of a general update of our crystallization tools over the last year, we have just updated the utilities and models for size distribution calculations in DynoChem Resources.
The CSD/CLD tools are primarily for academic research purposes, rather than industrial application. This is for two main reasons: i) most industrial problems can be solved without modeling the number balance/size distribution and ii) quantitative interpretation of measured size data for modeling remains a challenge (see e.g. reference 1). Our models include options to 'calibrate' e.g. CLD data to close the mass balance.
For an example of mainstream application of DynoChem to industrial crystallization problems, see our Crystallization training exercise instead (Operation 5 in the manufacturing stage).
References
1. Zai Qun Yu, Pui Shan Chow and Reginald B. H. Tan, Interpretation of Focused Beam Reflectance Measurement (FBRM) Data via Simulated Crystallization, Organic Process Research & Development 2008, 12, 646–654, http://pubs.acs.org/doi/abs/10.1021/op800063n
“We did promise you a blast of U2 and I think you’ll agree that it has, indeed, been a Beautiful Day.” And the audience certainly agreed with Joe Hannon as the discussions continued and new ways in which to use DynoChem as it develops its capabilities were suggested.
Joe then outlined some of the exciting new developments that DynoChem users can expect in the future. “Thanks to Steve Hearn and our Development Team, we’ve made DynoChem easier to roll out and made it quicker and simpler for your IT colleagues to manage".
Forthcoming initiatives include a new interface in the DynoChem Resources website using Microsoft Silverlight to provide easier search and navigation. In the meanwhile Joe urged users to visit DynoChem Resources to find out more about other ways in the software can help speed experimentation and reduce costs.
Not surprisingly given the quality of the day's presentations, finding a winner of the prize for best presentation was tough and when customer votes were counted, at first it seemed that there had been a three-way tie for first place. However a quick recount revealed that Marcello Bosco of Roche Basel (pictured above) was the outright winner with his discussion of "Thermal Scale-up – Vessel Characterization and Reaction Modelling with DynoChem".
Amid envious glances from colleagues, Marcello walked away with an iPad 2. Great for tapping out ideas when inspiration strikes outside the lab!
Joe ended with a call to action. “We’re proud to be sponsors of an AIChE award for excellence in quality by design, along with Pfizer and Merck and I’d like to ask you to get in contact if you know of any additional candidates for the 2011 prize, people who are doing great work that should be recognised."
When it comes to achieving these excellent results, DynoChem will be there, playing its part.
Registration has opened for the DynoChem 2011 User Meetings, taking place in Chicago, London and Mumbai, where pharmaceutical companies will share 'Recipes for Success' in April and May 2011. More details at http://www.scale-up.com/UGM11.html.
Building a population balance model / framework is quick and easy, especially if you start from a readymade template. Making the model fit your data is more time-consuming and the quality of fit (and confidence ellipsoids) may be reasonable, though the relevant 'kernels' may be too simple or too averaged to fit really well. Making accurate predictions with your model, especially with a change of scale and equipment configuration, adds a further layer of effort to be successful, as the balance among the important phenomena may shift away from your original conditions. In some industries, this level of effort may be indulged; in the fast moving pharmaceutical development project, it usually will not, depending on the phase of development and the questions that need to be answered.
Common sense tallies with our experience in this area, that users need to understand / model first the mass balance, then the energy balance and then possibly the number / population balance. In many projects, trying to start at the wrong end (the population balance) only reveals that the mass and energy balance are not understood. On the other hand, starting with mass (concentration, addition rate, solubility) and energy (temperature, cooling / evaporation rate) alongside a basic evaluation of equipment characteristics (agitation, solids suspension, heat transfer resistance) often leads to insight that solves problems without requiring a population balance approach.
In these more routine projects, on-line size data (such as FBRM) are useful as a diagnostic and to provide trend information.


.png)
.png)
.png)


