Friday, March 28, 2014

Are you certifiable? Take the test to become a Certified DynoChem User

DynoChem skills are a great asset to have in a pharmaceutical company.  They can make your job more interesting and satisfying while making you more effective and faster in completing projects.  They allow you to help others in your team to get the same benefits.  They're also great for your career progression and future employment prospects.

Now you can demonstrate these skills to all by becoming a Certified DynoChem User, on successful completion of a Certification Test.

We've anticipated a few of your questions and provided the answers below:

Q: What exactly do I have to do?
A: Take a 90-minute certification test using DynoChem at your own desk.

Q: How do I get the test questions?
A: Send an email to our support and training team with 'Certification' as the subject line.

Q: What do I get in return?
A: Several things:

  • You can describe yourself as a Certified DynoChem User.  
  • You receive an official signed and stamped certificate to this effect (hardcopy and PDF).  
  • You can hang it on your office wall, use it  in your resume, list it in your LinkedIn profile, etc.

Q: Sounds great.  Let the games begin.
A: Steady on.  Email us now to get your copy of the test.


Tuesday, March 4, 2014

The best solubility tools just got better

Solubility regression (once your solvents have been selected) is one of the most valuable things you can do for crystallization process design.  We have provided tools for this for nearly 15 years and continue to enhance them in response to feedback from users.  We recently improved our late phase tool, which has fitted every solubility(Temperature, antisolvent) dataset we have seen, to the point where you can have an expression within 1 minute of pasting in your data.  There are also some sophisticated design calculations in our late phase tool that quickly lead to sensible process operating lines including cooling and addition rates.

Solubility prediction (in a range of solvents and mixtures before selection) is valuable at an earlier stage in process development, when you may know some of your process goals but lack knowledge about what solvents to focus on during fast paced early development.  Measured data are scarce at this early phase; however ab initio predictions (e.g. from molecular structure or quantum chemistry) are either inaccurate, too specialized or both.  We like methods that are a mix of predictive and correlative, i.e. that leverage a small set of experiments to predict behaviour in a vast array of solvents and mixtures.

NRTL-SAC is technically an attractive option in this area and is the subject of patents, making it unclear whether the published method can be implemented independently and incorporated in tools used to solve problems in industry.  We decided in 2009 that we would not expose our customers to the intellectual property risks of using this method and instead dedicated a significant effort to producing an alternative.  The result is a method called Regressed UNIFAC (RU), which makes the most of UNIFAC as a means to calculate solvent-solvent interactions and adds a new 'group' for solute, whose interaction parameters are fitted to data.  These steps overcome limitations of standard UNIFAC and now most of our pharma customers rely on this method during early development of crystallization and also solvent selection for chemical reactions.  You can download the tool here.

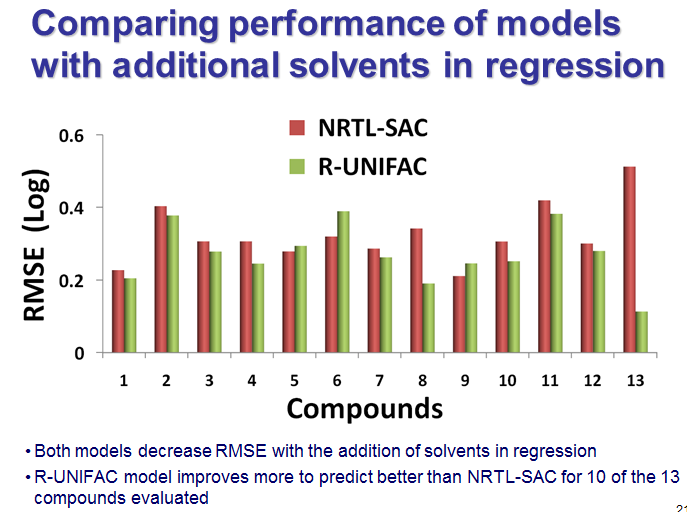
We tested the method for published solubility datasets and took steps to make it easy to use for our pharma customers; for example, you can work in friendly units, like g/L or even L/g and call any of the 160 solvents friendly names.  That flows from our company culture that seeks to delight customers.  We have been delighted too with the results in cases where RU was compared with NRTL-SAC, like the set of compounds below from a BMS presentation, which feature in a recorded webinar that DynoChem Resources website members can watch on demand anytime.  The plot shows the relatives magntudes of the prediction errors for the two methods, for a total of 13 compounds.  The green error bars for RU are smaller for 10 out of 13 compounds (77% of cases).

You can find out more about RU in knowledge base articles in DynoChem Resources.  Let us know too if you would like to see features simplified or added.

Tuesday, February 25, 2014

More on size distributions

When completing the publication of our latest monthly update to the DynoChem online library of tools, we revised our CSD (crystal size distribution) to CLD (chord length distribution) conversion utility and the latest file is here.

We think this tool has educational as well as practical value, with plots of size distribution statistics and indications of how true CSD relates to what we can measure using on-line laser backscattering (an apparent CLD) or off-line laser diffraction (an apparent spherical equivalent diameter distribution).


Like all of our tools, we are keen to receive feedback by email to our support team and to make further enhancements in due course.  If you like it, or think it can be improved, let us know.

Believe it or not, it is possible to find humour even in such technical material and we present below our latest CSD joke, this time from the Doctor, Doctor genre.  It goes:
  • Patient: 'Doctor, Doctor, I don't understand the statistics of my size distribution.'
  • Doctor: 'Please weight a moment.'
If you like the joke, or can improve it, write a comment.

Wednesday, February 19, 2014

New DynoChem Solvent Swap Distillation Tool went live today: webinar Tuesday 25 Feb

You may know it as "solvent switch", "solvent swap", "solvent exchange", "strip and replace", "feed and bleed" or any number of other names; the fact is,  if you make pharmaceutical intermediates or APIs, you are doing this in almost every manufacturing stage, sometimes more then once.

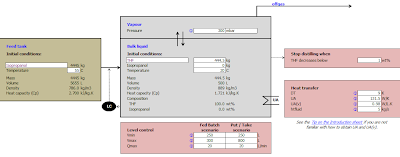
Good news then that the DynoChem solvent swap distillation tool has been made even easier and faster to use with today's online library update, including a brand new simple interface that requires no DynoChem knowledge to drive:


Now you can find out how many volumes are needed, how much time it will take, which vessel to select and what the composition trajectory will be, in even less time than before.

Next week there is a great opportunity for a refresher on solvent swap, as our Chemical Engineering webinar series features this topic in both of Tuesday's sessions.  Attend live if you can; register to make sure you receive a link to the recording.

If you're new to the area, there some more good background information on solvent swap here.

Monday, February 10, 2014

Bourne reactions for vessel characterization

Many are familiar with the term 'solvent test' as a means of characterizing vessel heat transfer and sometimes also gas-liquid mass transfer.  Another type of characterization test addresses the turbulent energy distribution in a vessel and uses experiments with Bourne reactions (mixing-sensitive) together with a mathematical model.

These techniques enable a quantitative estimate of the local power per unit mass (or volume) at a specific feed location.  That is useful when scaling processes that are mixing-sensitive, such as some fast / dosing-controlled reactions and some antisolvent crystallizations.

XQ (or XS) from the Bourne chemistry depends on the mixing rate near the feedpoint.  When the experiments are micromixing-controlled, XQ is independent of feed time; this occurs at longer feed times.  In those circumstances, the local epsilon (W/kg) may be estimated directly from the Engulfment frequency that corresponds with the measured XQ:

(Equation 1)

An example model-generated curve relating XQ and epsilon is shown in Figure 1 below: given a measured XQ under micromixing-controlled conditions, epsilon can be read from the x-axis:


Figure 1: Example plot of XQ versus epsilon (W/kg) under micromixing-controlled conditions.

The value of experiments to measure XQ depends on running the chemistry under mixing-sensitive conditions.  If you are planning experiments like these, you should first use a model with estimated epsilon to identify both chemical (concentrations) and mixing conditions (e.g. rpm) that will lead to sensitivity in your case.  Our utilities provide good estimates of the parameters you need.  Then when you have your measured XQ results, you can back-calculate epsilon.

DynoChem is the only software that contains these readymade tools for characterizing your equipment and handling micromixing and mesomixing limited systems during process development and scale-up.  Sign up to find out more.

Sunday, February 2, 2014

Readymade templates for mesomixing and micromixing calculations in DynoChem

Ed Paul of Merck opened up this field in the early 1970s following observations of mixing-sensitive reactions at industrial scale and completed a PhD on the topic under Robert Treybal.  John Bourne started a series of systematic investigations through the 1980s and 1990s and together with Jerzy Baldyga laid the basis for quantitative predictions in this area.

There continues to be a high level of interest in micromixing and applying the concepts to solve practical problems that arise frequently in both lab and plant. Bourne and Baldyga coined the term 'mesomixing' and it turns out that this may be the more important phenomenon in reactions at scale, with practical feed addition times of a few hours.

Researchers needed well characterized reaction kinetics in order to study the field and a number of 'Bourne reactions' emerged, each showing sensitivity of the final (end of reaction) product distribution to fluid mixing conditions during reaction. One such reaction is an  ester hydrolysis with competing parallel neutralization: the fraction of the limiting caustic reactant that forms ethanol is denoted 'XQ' and in general is sensitive to mixing.

Mathematical models played a central role in this research and while there is still some debate about the 'best model', the Engulfment approach from Baldyga and Bourne probably has the most support.  This is easily applied to plug flow reactors (PFRs) with the reaction zone growing as the fluid travels downstream. For systems with backmixing, such as a fed batch reactor or a CSTR, a series of plug flow circulations may be used to simulate the successive changes in XQ over time and the final or steady state result.

Several of the papers referred to above could be considered quite complex and challenging for non-specialists to apply.  Three of our team obtained PhDs in this field during the 1990s.  As a result, the DynoChem Resources online library contains a PFR template for meso- and micromixing as well as much background material and a vessel utility to estimate the various time constants required and to check for 'jetting effects' or feed pipe backmixing.

We also developed a feed zone model that captures the behaviour of the Engulfment model and mesomixing in stirred vessels without simulating a series of successive PFR circulations.  This feed zone can easily be included in any single or multi-phase simulation (e.g. antisolvent crystallization) in order to predict the effects of locally high concentrations or temperatures near a feed point. The key concept in this feed zone model is to calculate how quickly the feed is diluted to a composition close to the average in the vessel; this time scale depends through the Engulfment model on the meso- and micromixing time constants, which in turn depend on the reactor geometry and operating conditions.  A full picture is obtained by combining the results of our utilities with a dynamic model.

The first plot below shows XQ predicted under typical reaction conditions using PFR circulations compared with XQ from the feed zone model, in a vessel of 800L volume to which 16L of caustic were added over feed times varying from 5 minutes (mesomixing controlled, at 800L scale) to 100 hours (micromixing controlled). Perfect mixing would give XQ of almost zero, while complete segregation would give 50%. The results range from 15% to 25% in this case. The feed zone model predicts XQ within a few percent of the PFR circulation model and shows similar mixing-sensitivity of the process in this operating range with a much simpler model implementation.


The second plot below shows predictions from the feed zone model when the agitation conditions (and thereby the Engulfment frequency) are changed for a fixed addition time of 10 hours (micromixing controlled).  At the extremes of very slow and very rapid micromixing, XQ tends to 50% and 0% respectively.


Subsequent posts will discuss use of these reactions with DynoChem to characterize lab and plant equipment and application of the models to predict mixing effects on crystallization.

Wednesday, January 29, 2014

DynoChem population balance models for crystallization: effect of seed amount on crystal size distribution

Templates that use nucleation and growth kinetics in population balance models have been available in the DynoChem online library for some time.  These are a great alternative to writing all of your own code for this problem in MatLab or Excel, or investing in complex software that is in permanent beta-test mode and 'one up from Fortran'.  On the other hand, our templates give you total control over the form of the rate equations, so they are ideal for research purposes.  And you benefit from the features that power users love, like variable time steps, stiff solvers, flexible data handling in Excel format and so on.

DynoChem provides a general-purpose platform for operation modeling and the same environment can be used for anything from early phase reaction kinetics by process chemists through to late phase solvent swap, filtration and drying by process engineers and beyond that into drug product, dissolution and stability applications.  In the pharmaceutical industry, makers of API find countless opportunities to apply these tools over and over again.

Our population balance models come in various shapes and sizes, depending on what you need to accomplish.  The most rigorous of these divide the distribution into size 'classes', with linear or log-spaced intervals, and calculate the number of crystals in each class during nucleation and growth.  Another variant does the reverse, with breakage and dissolution as API crystals dissolve from a tablet in the USP apparatus (or the stomach).

Knowledge of solubility and measurement of some crystallization profiles (notably solute concentration during crystallization) allow the kinetic parameters to be estimated, using the classical approaches described in Mullin's book and many other places.  Armed with reasonable estimates for these parameters, valuable insights into the CSD may be obtained.

During antisolvent crystallization, composition gradients may exist near the feed point and even this can be predicted efficiently using meso- and micromixing models implemented by our team of fluid mixing experts. In general, equipment characterization completes the picture, with the ability to calculate heat transfer, solids suspension and power per unit volume using simple 'utilities'.

Here we show the beneficial impact of seed addition during a cooling crystallization: more seed (up to maximum 3.2% in this case) suppresses nucleation, eliminates a bimodal size distribution (and filtration problems plus product variability concerns) and leads to smaller sizes and a tight distribution.


ShareThis small